Introducing xPTS:
Expected Points, Basketball's xG
The following is xPTS v1 data. xPTS v3 can be found here.
Good day to you reader. I hope you are having a good day as you stumble upon this paper. My name is Ayo and, as much as I love basketball, I am Nigerian, thus soccer, or rather football is in my blood. Grew up playing it, studying it with my father. I routinely keep up with it through the Premier League and the UCL primarily and am currently really enjoying watching this World Cup with my father. If you tuned into any World Cup games this year, one of the things you'll see repeatedly on game summaries and even in missed games is expected goals per team.
I want to take some time and write a quick blog explaining a new stat that I tinkered with and created that borrows from the concept one of the foundational analytics in football, that being xG.
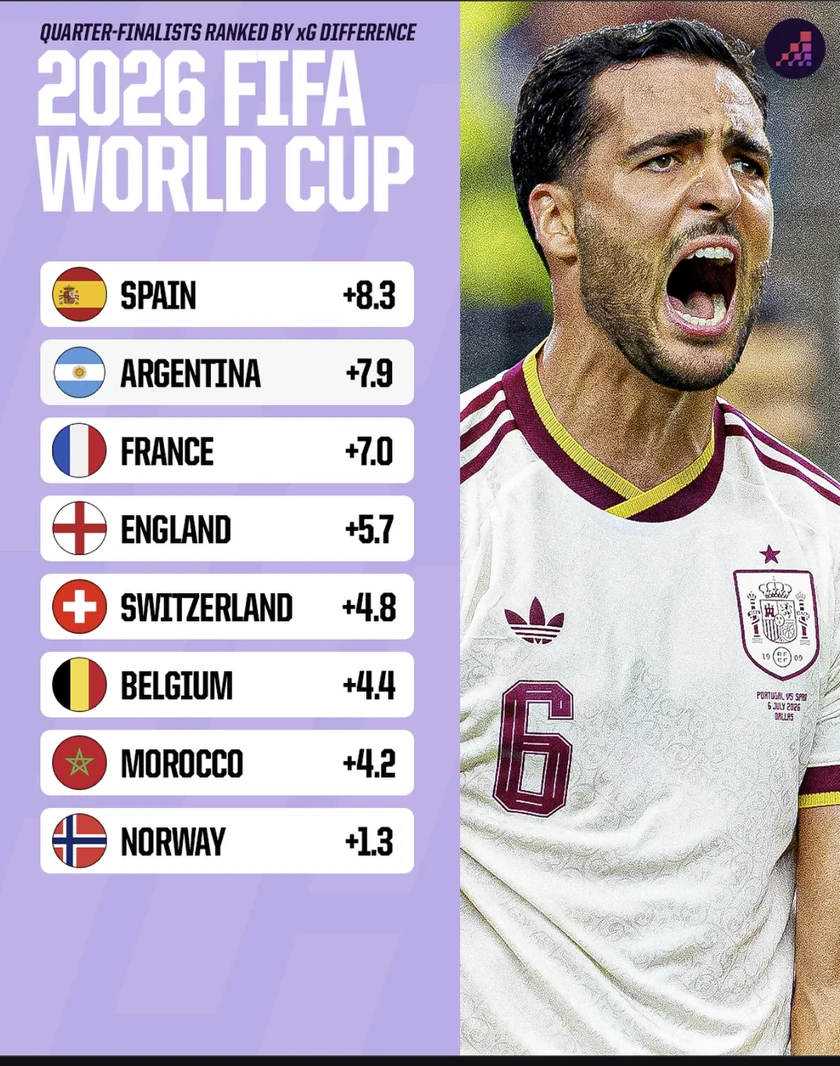
What Is xG?
xG is football's statistical measure of a shot as it relates to its goal.
Given the skill of an average player, how good of a goal opportunity was a shot?
It strips away the luck and skill differentiation and focuses on the process of the shot in isolation.
Every shot is given a quality grade between 0 and 1, with 1 representing a guaranteed goal. A shot graded with an xG of 0.10, means over 100 times it would be statistically expected to be a goal 10 times (1/10).
For added reference, a penalty kick typically has an xG of about 0.79.
xG is calculated from hundreds of thousands of shots, using factors such as:
- Distance and angle to the goal
- The type of pass that led to the shot
- The body part that used a shot
- Defender proximity
- Goalkeeper positioning
- And so forth
What makes xG so intriguing to me is that, over a long enough sample size, teams that lead in xG win proportionally — it's a beautiful proxy for process over results. Over a single season the correlation is considerably less, only around 48%, and that's exactly where the differences in luck and skill of conversion show up. (more on this later)
XG is also extremely versatile in the context it provides and the stories you can tell with it. You can use XG on a team level over the course of a season or seasons to see their relative strength and performance.
You can constantly see XG tables right next to the actual league tables and see the differences between actual performance and expected performance. You can also do it between teams on a game-by-game level to see whether a team should have "won" a game, or to better ascertain the approximate game state.
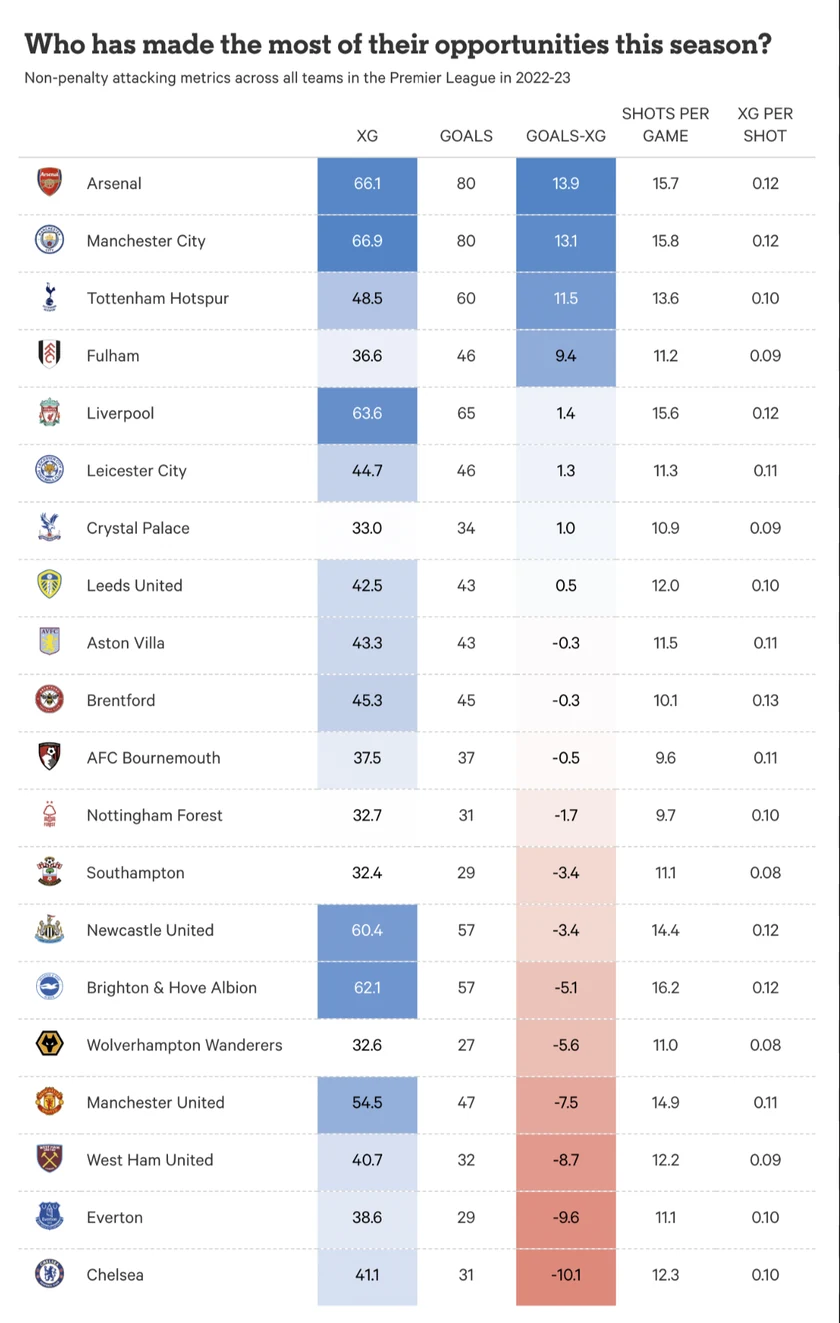
And Even cooler, you can do it on a player-by-player basis: to see how much better or worse a player's finishing was compared to the league average.
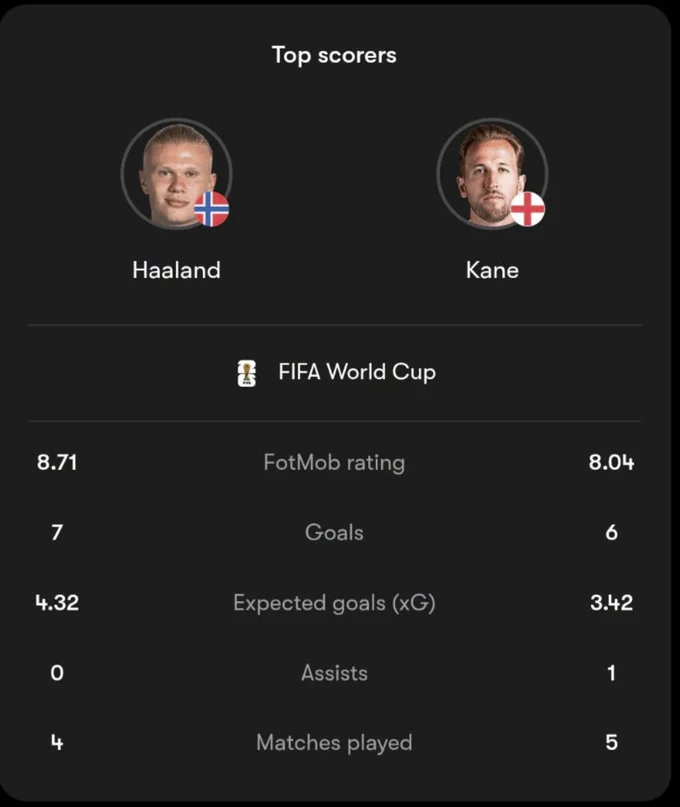
A player such as Harry Kane, who has been playing extremely well in this World Cup, consistently overperforms as xG while there are other players who underperform. A lot of nuance can come with this too, as even the ability to rack up xG both on a player and team level is a testament to at least their chance creation.
Watching this World Cup reminded me of a conversation I had with my best friend from when we were watching the Man U game about how cool it would be to bring the concept of XG to basketball. I spent a week-ish tinkering with models and created xPTS, my iteration of basketball's version of xG.
What Is xPTS?
xPTS are the expected point valuation of each field goal and free throw attempt compared to league average.
It grades each shot attempt on a scale from 0 to 3, based on how many points that shot would be expected to produce if taken by a league-average NBA player, though in practice no shot exceeds approximately 2. It completely strips out luck and individual conversion skill, aiming only to quantify shot quality.
A proper xPTS formula uses a granular location shot chart, in which you divide the basketball court into different shot zones, as well as defender-distance data. More on this later.
Prior Art
Though novel in its approach, xPTS is not the first attempt at quantifying NBA shot quality.
EPV (Expected Possession Value) was created by Daniel Cervone, Alex D'Amour, Luke Bornn, and Kirk Goldsberry in 2014. It is a full-possession simulator that prices every moment of a possession in terms of expected points: sprints, passes, screens, dribbles, shots, and everything in between. It is a very beautiful creation, but it requires proprietary SportVU tracking data, including player and ball coordinates captured at 25 frames per second, which the league stopped making public after 2016. It is extremely closed-source. EPV is also not shot-level. It values the entire possession as a flowing chain, so you cannot isolate "this shot was worth X" the way xG or xPTS does. It also cannot be decomposed into scored versus created.
qSQ (Quantified Shot Quality) developed by Second Spectrum is the most similar to xPTS in spirit because it grades each shot based on what a league-average shooter would be expected to do with it. qSQ uses actual defender distance on every shot, along with shooter velocity and the positions of the closest and next-closest defenders. It is the gold standard for shot quality and is also entirely proprietary. No one outside the league can see the model, the data, or the outputs. It produces a probability, expressed as expected eFG%, rather than an additive points currency, so it cannot be summed into a season total or decomposed as Xpts.
EPAA (Expected Points Above Average) was developed by Williams, Schliep, Fosdick, and Elmore and published as an academic paper in 2024. It uses Bayesian hierarchical modeling to evaluate shooters relative to league average while adjusting for shot difficulty. It is a rigorous academic contribution, but it is a player-ranking tool rather than a scoring currency. You cannot sum it into a team total or divide it into scored and created value. It also does not include defender distance.
The Bin
The key point of xPTS is deciding where to average out. Where does an average shot begin?
If we say the value of an NBA shot is about 1.09 points per attempt right now, how granular do we want to get? A wide-open layup, and a contested pull-up three have different expected shot values.
You can get as granular as you want. The question is what a good stopping point is, because it has a huge effect on the resulting expected-point averages and totals.
On one hand, one could count every unique combination of location, distance, shot type, defensive pressure, possession context, and so on across the roughly 219,000 recorded shots and give each one its own expected value.
You would be conserving all available context and getting the purest expected value, but you would also be creating thousands of extremely thin categories. As a result, the expected-value averages would be unusable because they would be so unstable.
A halfcourt heave from the left, taken with 20 seconds remaining, with a defender five feet away in semi-transition, cannot have happened more than 10 times in a season. If a team somehow hit 4 of the 8 they attempted, the raw value per shot spikes to 1.50 points a shot, on a shot that in reality is worth closer to 0.90.
On the other hand, you could have fewer but extremely large shot categories. These would produce stable averages, but also unusable numbers. The meaningful differences between attempts and shot contexts would be lost.
A wide-open catch-and-shoot transition three from the right corner is meaningfully different from a self-created, semi-contested pull-up three. These shots have different expected-point values intuitively, and we expect them to differ in both shot difficulty and expected-point valuation.
My initial solution was creating the concept of a bin, a repeatable, systematic definition of a shot type. Each field goal attempt is placed into a bin based on four characteristics:
- Court zone: 14 zones
- Shot distance: two-foot increments
- Shot family: drive, cut, catch-and-shoot, self-created, alley-oop, or putback
- Possession context: halfcourt, transition, second-chance, or off-turnover
This codified approximately 707 bins per season across roughly 219,000 field goal attempts.
The average bin looks like the following:
For this bin, there is no need for any other adjustment as the sample size over the 29 years makes the expected point value extremely stable. Though there are shot types and bins that encompass rare shots, such as a second-chance catch-and-shoot from the right wing, 22 to 24 ft. away from the rim.
As for this bin, two lucky makes on five attempts make that raw average 1.99, extremely unreliable.
Though, because of the hierarchical nature of the bins (zone × distance × family × context), each one sits inside a broader parent bin that only keeps its location as the primary signifier. The parent bin pools every shot taken from that spot with that hierarchical location.
I then run a Bayesian regression that pulls the thin bin’s shaky average back toward the fat, stable location parent bin. In this case. weighing the bin’s 5 attempts against 50 attempts’ worth of the parent location average.
The rarer the bin, the fewer samples within it, the more prominent the regression, and the more it leans on its parent.
The formula combines the 5 shots of raw data with 50 shots’ worth of the zone average, so the final price becomes 0.97 xPTS instead of 1.99. Right now there actually aren’t that many thin bins, so this regression tactic is barely used, as the numbers below show:
Here is a sampling of bins across the value spectrum.
A sampling of the 707 bins. Most rows stand alone, but a few are paired open versus smothered so you can see how much the nearest defender moves the price.
The 2015–16 Season and Defender Distance
The 2015–16 NBA season is the only season for which the complete xPTS formula can be calculated using all four inputs:
- Shot location
- Shot family
- Possession context
- Actual defender distance
As it is the only season with publicly available defender-distance data for individual shots, drawn from "leaked" SportVU tracking data.
For every other season, both before and after 2015–16, I use an approximated version of xPTS that prices shots using the aformentioned location, shot family, and possession context, but wihotut defender distance. This approximated version is essentally a shot location router and captures roughly 77% of the accuracy estbalished by the full formula.
The Final Product
Put all of this together and you are left with xPTS: a beautifully additive and decomposable measure of shot quality that is extremely versatile. Here are a few of the ways I have found to use it.
Player leaderboards. Because it is additive, you can build a leaderboard of the expected points a player created, whether by his own shot or by the pass that set one up, over a given season. The board below does exactly that.
Team leaderboards. Sorting teams by expected wins derived from xPTS chance creation and suppression.
A player’s own baseline for over and underperformance. The league-average foundation can be swapped for a player’s own averages from each shot location, giving you a player-specific xPTS. Over a stretch of games you can then see how much better or worse he is shooting by his own standards.
Football Adjacent Game by game summaries: Summaries that show who created the better statistical chances and the distribution of it. A team can lose the scoreboard and still have won the shot quality.
Presence and geometry RAPM. Even cooler, you can measure how a player’s presence bends his team’s offensive and defensive geometry, and its chance creation on both ends, a different flavor of regularized adjusted plus-minus. More on that below.
xPTS Scored is the sum of xPTS on a player's own shots. xPTS Created is the xPTS of the shots his passes generated. X Score adds the two together. The 2015-16 board is starred because it uses real per-shot defender distance.
Expected Wins
One of the best uses of xPTS is having a game-by-game comparison, with xPTS being a stand-in for chance creation or a quantification of a team's process. You can add up each player's xPTS on two separate teams for each game and then compare which team should have won. A very rudimentary comparison of which team should have “analytically won.”
 CLE

Every field goal attempt priced by the 2025–26 league bin table; every free throw at the league rate of 0.78. Play-by-play context approximated from public data.
 Expected pointsxPTS

San Antonio analytically won six out of seven games in the 2025–2026 playoff series against the Oklahoma City Thunder. In the games that Oklahoma City won, they analytically lost via xPTS but won via sheer conversion rate.
How Well Do xPTS Predict Wins?
One of the cool things xG in soccer allows is to see, over a period of time, most often a season, who the best teams are based on the quality of chances they create. Go back through a season and assign each game to the team that created more xG, and that expected table explains roughly 75–80% of the eventual final league table.
In the NBA, expected wins derived from expected points explain only about 50% of final wins (R² ≈ 0.49 across the full 2025–26 season). I was very curious as to why, and as I dug through it, I found three main reasons for the divergence.
- The value of chances in football is much wider than basketball. A soccer xG valuation on a given shot can range from 0.03, half a chance, to 0.79, a penalty, a nearly 26x spread. The chances one can get in soccer vary widely, most of them are low and not expected to convert. Soccer is a 90-minute jousting match between two teams to see who can create the most clear-cut chances.
- Football conversion is extremely unstable year over year. Only a handful of players on the planet consistently outperform their xG. For the majority of players and teams, their xG is destiny.
- Conversion is basketball's skill. Shots range from 0.53 expected, a smothered late-clock pull-up, to 1.77 expected, an open alley-oop at the rim in transition. A spread of a measly 3x. This is wildly different from soccer: even in differing shot contexts, basketball shot opportunities are close together in their eventual expected value.
Chance creation is still a strong barometer of eventual team performance. Across all 1,230 games of the 2025–26 season, the team with the higher Total xPTS won 62.1% of the time. When the xPTS differential is 5 or more, it predicts the winner at 67.9%, and at 20 or more, it reaches 80.2%, soccer territory.
This holds across every season the full bin engine covers. Pooled over the five seasons of play-by-play rich enough to power it, 2021–22 through 2025–26, 6,150 games, the higher-xPTS team won 57.2% of all games, 61.0% at a differential of 5+, and 73.2% at 20+. The chart below pools all five seasons.
In 14.5% of games this season, the xPTS margin was inside two points. Chance creation, or xPTS, was essentially worthless and less accurate than a coin flip in those games.
| Season | Premier League R² | NBA R² |
|---|---|---|
| 2021–22 | 0.89 | 0.14 |
| 2022–23 | 0.82 | 0.09 |
| 2023–24 | 0.82 | 0.26 |
| 2024–25 | 0.88 | 0.37 |
| 2025–26 | 0.78 | 0.49 |
R² is the percentage of the variance in the actual table that the expected table explains. An R² of 1.00 means a one-to-one match.
- NBA over/under-performance repeats year after year: r = 0.52 (120 team-season pairs). Teams that beat their expected wins keep beating them.
- EPL finishing over expected points repeats at r = 0.06, literally zero. In football, conversion is lossy, with creation being law.
Expected wins award each game to the team with the higher net xPTS that night. Over/Under is actual wins minus expected, the conversion signal. Across 2025–26, expected wins track actual wins at R² ≈ 0.49.
As I was working on this section, I shared an excerpt of the unfinished version on Twitter, and a question from @Yim0e made me go back and be more thorough. This paper took much longer than anticipated to get out. It was initially supposed to be a casual blog sharing a weekend experiment, but I hate putting out unfinished stuff, and each time I got a nudge like this I leaned in: run the test, really understand the thing you built.
They asked whether xPTS is a better predictor of future results than actual efficiency, whether that be eFG% or true shooting. So I built the test, took all 30 teams for every season I have full, proper data for, 2021 through 2025, and created 120 this-season-versus-next-season pairs. For each pair, I asked which number best predicts a team’s actual net rating the following season: the team’s xPTS net, which is two way chance creation/supression; the team’s actual net, creation and conversion together; or both melded into one model.
| Predictor of next season’s actual net | r | R² |
|---|---|---|
| This season’s actual net | 0.55 | 0.30 |
| This season’s xPTS net | 0.38 | 0.14 |
| Both together | 0.55 | 0.31 |
120 team-season transitions, 2021–2025. Adding xPTS to actual net moved R² from 0.30 to 0.31: essentially nothing.
For added detail, I measured how each component repeats from year to year. Chance creation repeated at 0.52. Conversion repeated at 0.54. This was the interesting finding.
In football, xG is a better tool for prediction than actual goals, because conversion in football is lossy and does not repeat. In basketball, conversely, conversion is one of the defining skills, and it does repeat. It is the critical context that separates an average team from an elite team, not the creation of chances.
The difference between two chances in basketball, especially without proper defender-distance data, is far more compressed than the difference between chances in football. A penalty is enormously more likely to convert than a 40-yard shot, but in basketball a layup is relatively as easy to convert as a three-pointer is, and the harder shot is rewarded with 1.5 times the value. And the nature of the sport is that both teams get a similar number of chances per game. Teams see roughly the same possessions and shots; unlike soccer, you cannot hold an opponent to zero chances while creating eight. The differences that remain are minute, a team’s pace or its turnover economy.
So the creation of xPTS, or any form of expected points, cannot really be used to predict a team’s future performance. It is added context for how a team gets to its end result, and it is, more than anything, a confirmation of how critical shot conversion is. Tough shot-makers, shot-makers in general, the players who consistently help their team convert chances into buckets and into value, carry an incredible amount of it.
Back to the Individual Level
xPTS is an extremely versatile statistic that, when done properly, can be used to quantify the process of an NBA offense and defense, both on a granular player and team level. It also gives insight into the atomic root of value creation in the sport, that being conversion.
You can see who the best shot converters are by using xPTS over any given time period. For the 2025-26 season, you can see who has made the most of their chances, converting far above the league-average expected points.










Even more excitingly, you can examine over- and underperformance on a single-game level. You can see the performances that are extremely load-bearing and may not be sustainable, and the poor form that lands far, far away from what we would expect.















You can also swap out the league-average baseline in the formula for a player’s own baseline from each bin, so you can see, on a game-by-game or even season-by-season level, whether they are playing above or below their own level, whether they have hit a hot streak or gone unusually cold.
Stephen Curry’s expected points on a deep pull-up three are wildly different from the league’s.
xPTS-RAPM
Finally, the piece I have been most excited about, and the one in the title of this paper: xPTS-RAPM. Instead of seeing how a player's on-court presence adds to or subtracts from a team's net rating over a huge sample of possessions, you see how a player's on-court presence influences a team's expected point value. Are they creating numerically optimal shots? Are they suppressing numerically optimal shots? How are they warping the geometry of the court?
| # | Player | Off | Def | Net xPTS-RAPM | Poss |
|---|---|---|---|---|---|
| 1 |  Giannis Antetokounmpo | +2.36 | +0.52 | +2.88 | 10,117 |
| 2 |  Brandin Podziemski | +1.33 | +1.21 | +2.54 | 6,054 |
| 3 | Nikola Jokić | +1.31 | +1.08 | +2.39 | 11,228 |
| 4 |  Jimmy Butler III | +0.78 | +1.50 | +2.29 | 8,206 |
| 5 |  Jonathan Isaac | +1.29 | +0.90 | +2.19 | 3,410 |
| 6 |  Franz Wagner | +0.57 | +1.51 | +2.07 | 9,674 |
| 7 |  Amen Thompson | +1.52 | +0.55 | +2.07 | 6,296 |
| 8 |  Fred VanVleet | +0.99 | +1.02 | +2.02 | 10,260 |
| 9 |  Tari Eason | +1.77 | +0.16 | +1.94 | 5,183 |
| 10 |  Steven Adams | +1.57 | +0.33 | +1.90 | 2,643 |
| 11 |  Andre Drummond | +1.61 | +0.18 | +1.79 | 4,049 |
| 12 |  Ausar Thompson | +0.81 | +0.90 | +1.72 | 4,860 |
| 13 |  Alex Caruso | +0.60 | +1.11 | +1.71 | 6,413 |
| 14 |  Luke Kornet | +0.88 | +0.78 | +1.66 | 4,632 |
| 15 |  Chris Boucher | +1.57 | -0.00 | +1.57 | 4,085 |
| 16 |  OG Anunoby | +0.80 | +0.76 | +1.56 | 9,851 |
| 17 |  Alperen Sengun | +0.87 | +0.55 | +1.42 | 9,639 |
| 18 |  Clint Capela | +1.38 | +0.04 | +1.42 | 6,850 |
| 19 | Donovan Mitchell | +0.81 | +0.61 | +1.42 | 9,542 |
| 20 |  Anthony Davis | +0.38 | +1.04 | +1.42 | 9,049 |
| 21 |  Dyson Daniels | +0.24 | +1.17 | +1.40 | 8,204 |
| 22 |  Pascal Siakam | +0.29 | +1.10 | +1.39 | 11,402 |
| 23 |  Scottie Barnes | +1.33 | +0.06 | +1.39 | 9,773 |
| 24 |  Rudy Gobert | +0.11 | +1.25 | +1.36 | 10,198 |
| 25 |  Toumani Camara | +0.56 | +0.79 | +1.35 | 7,402 |
| 26 |  Payton Pritchard | +0.75 | +0.58 | +1.33 | 7,353 |
| 27 |  Dillon Brooks | +0.60 | +0.70 | +1.29 | 9,953 |
| 28 |  Kevon Looney | +0.81 | +0.47 | +1.28 | 5,803 |
| 29 |  Goga Bitadze | +0.50 | +0.77 | +1.27 | 4,454 |
| 30 |  Josh Hart | +1.45 | -0.18 | +1.27 | 11,603 |
| 31 |  Day'Ron Sharpe | +1.32 | -0.06 | +1.26 | 3,529 |
| 32 |  Moussa Diabaté | +1.23 | +0.00 | +1.23 | 2,617 |
| 33 |  Isaiah Hartenstein | +0.51 | +0.72 | +1.22 | 7,389 |
| 34 |  Josh Okogie | +1.23 | -0.02 | +1.22 | 3,781 |
| 35 |  Deni Avdija | +0.62 | +0.59 | +1.22 | 9,457 |
| 36 |  Moses Moody | +0.17 | +1.03 | +1.20 | 5,680 |
| 37 |  Donovan Clingan | +0.89 | +0.30 | +1.19 | 2,610 |
| 38 |  Mitchell Robinson | +1.02 | +0.14 | +1.16 | 3,043 |
| 39 |  Moritz Wagner | +0.62 | +0.53 | +1.16 | 4,115 |
| 40 |  Domantas Sabonis | -0.54 | +1.68 | +1.14 | 11,700 |
| 41 | Aaron Gordon | +0.61 | +0.53 | +1.14 | 8,030 |
| 42 |  Draymond Green | -0.94 | +2.05 | +1.12 | 8,472 |
| 43 | Lauri Markkanen | +0.93 | +0.18 | +1.11 | 7,794 |
| 44 |  Jalen Suggs | -0.28 | +1.36 | +1.08 | 6,002 |
| 45 |  Isaac Okoro | +0.82 | +0.26 | +1.07 | 6,209 |
| 46 |  Jakob Poeltl | +0.10 | +0.95 | +1.05 | 7,120 |
| 47 |  Jae'Sean Tate | +0.57 | +0.48 | +1.05 | 3,257 |
| 48 |  Ja Morant | +1.44 | -0.39 | +1.05 | 5,584 |
| 49 |  Trey Lyles | +0.57 | +0.47 | +1.04 | 5,455 |
| 50 |  Jalen Brunson | +1.48 | -0.45 | +1.03 | 10,418 |
| 51 |  Bam Adebayo | -0.81 | +1.82 | +1.01 | 10,896 |
| 52 |  Anthony Black | +0.21 | +0.80 | +1.01 | 5,215 |
| 53 | Shai Gilgeous-Alexander | +1.17 | -0.17 | +1.00 | 11,431 |
| 54 |  De'Aaron Fox | +0.66 | +0.33 | +0.99 | 10,715 |
| 55 |  Kenrich Williams | +0.20 | +0.78 | +0.98 | 4,863 |
| 56 |  Trayce Jackson-Davis | +0.43 | +0.53 | +0.96 | 3,490 |
| 57 |  Gary Harris | +0.44 | +0.52 | +0.96 | 4,284 |
| 58 |  Evan Mobley | +0.33 | +0.62 | +0.95 | 9,060 |
| 59 |  Miles McBride | +0.98 | -0.04 | +0.94 | 5,531 |
| 60 | Luka Dončić | +0.65 | +0.25 | +0.90 | 9,516 |
| 61 | LaMelo Ball | +0.79 | +0.10 | +0.90 | 5,301 |
| 62 |  Dean Wade | +0.37 | +0.51 | +0.88 | 4,857 |
| 63 |  Dennis Smith Jr. | +0.70 | +0.16 | +0.85 | 2,781 |
| 64 |  Kevin Love | +0.36 | +0.48 | +0.84 | 2,966 |
| 65 |  John Konchar | +0.58 | +0.26 | +0.84 | 4,236 |
| 66 |  Gary Payton II | +0.42 | +0.42 | +0.84 | 3,138 |
| 67 |  Mikal Bridges | +0.52 | +0.32 | +0.83 | 12,649 |
| 68 |  Kentavious Caldwell-Pope | -0.28 | +1.11 | +0.82 | 10,016 |
| 69 |  Jarrett Allen | +0.42 | +0.40 | +0.82 | 10,090 |
| 70 |  Jayson Tatum | +0.56 | +0.25 | +0.82 | 11,412 |
| 71 |  Zion Williamson | +1.45 | -0.66 | +0.79 | 5,759 |
| 72 |  Sandro Mamukelashvili | +0.73 | +0.05 | +0.79 | 2,649 |
| 73 |  Tre Jones | +0.44 | +0.31 | +0.75 | 6,887 |
| 74 | Kawhi Leonard | -0.14 | +0.88 | +0.74 | 7,199 |
| 75 |  Kris Murray | +0.56 | +0.16 | +0.72 | 3,896 |
| 76 |  Duop Reath | +0.56 | +0.16 | +0.72 | 2,602 |
| 77 |  Derrick White | -0.43 | +1.15 | +0.71 | 10,591 |
| 78 |  Luguentz Dort | +0.25 | +0.46 | +0.71 | 9,725 |
| 79 |  James Harden | +0.23 | +0.48 | +0.71 | 10,906 |
| 80 |  Caleb Martin | -0.15 | +0.84 | +0.69 | 6,676 |
| 81 |  Dereck Lively II | +0.27 | +0.41 | +0.68 | 3,461 |
| 82 |  Oshae Brissett | +0.81 | -0.14 | +0.68 | 2,211 |
| 83 |  Lindy Waters III | +0.07 | +0.57 | +0.65 | 2,438 |
| 84 |  Dwight Powell | +0.32 | +0.32 | +0.64 | 3,652 |
| 85 |  Kelly Oubre Jr. | +0.84 | -0.20 | +0.64 | 8,400 |
| 86 |  LeBron James | +0.34 | +0.29 | +0.64 | 10,270 |
| 87 | Cade Cunningham | -0.30 | +0.93 | +0.63 | 8,261 |
| 88 | RJ Barrett | +1.36 | -0.74 | +0.62 | 8,729 |
| 89 |  Jordan Goodwin | +0.56 | +0.05 | +0.61 | 3,505 |
| 90 |  Keldon Johnson | +1.15 | -0.55 | +0.60 | 8,673 |
| 91 |  Mason Plumlee | +0.31 | +0.27 | +0.58 | 5,479 |
| 92 |  Kris Dunn | -0.75 | +1.31 | +0.56 | 5,900 |
| 93 |  Dalen Terry | +0.61 | -0.05 | +0.56 | 3,186 |
| 94 |  Xavier Tillman | +0.11 | +0.45 | +0.56 | 2,925 |
| 95 |  Kyle Lowry | -0.23 | +0.78 | +0.56 | 5,207 |
| 96 |  Stephon Castle | +0.90 | -0.35 | +0.55 | 4,311 |
| 97 |  Dorian Finney-Smith | +0.49 | +0.05 | +0.55 | 8,049 |
| 98 |  Keon Ellis | -0.26 | +0.81 | +0.55 | 5,219 |
| 99 |  Harrison Barnes | +0.59 | -0.05 | +0.54 | 10,438 |
| 100 |  Mike Conley | -0.19 | +0.73 | +0.54 | 8,362 |
| 101 |  Derrick Jones Jr. | -0.13 | +0.66 | +0.53 | 7,125 |
| 102 |  Jeremy Sochan | +0.54 | -0.01 | +0.52 | 7,337 |
| 103 |  Paul Reed | +0.18 | +0.34 | +0.52 | 3,748 |
| 104 |  Javonte Green | +0.54 | -0.03 | +0.51 | 3,309 |
| 105 |  Tobias Harris | +0.12 | +0.39 | +0.51 | 10,197 |
| 106 |  Herbert Jones | -0.07 | +0.57 | +0.50 | 6,385 |
| 107 |  Victor Wembanyama | -0.16 | +0.66 | +0.50 | 6,049 |
| 108 |  Austin Reaves | +0.12 | +0.39 | +0.50 | 10,571 |
| 109 |  Wendell Carter Jr. | -0.55 | +1.04 | +0.49 | 6,917 |
| 110 |  Josh Green | +0.11 | +0.37 | +0.48 | 7,350 |
| 111 |  Kevin Huerter | -0.28 | +0.76 | +0.48 | 7,787 |
| 112 |  Larry Nance Jr. | -0.27 | +0.74 | +0.47 | 3,948 |
| 113 |  Julius Randle | +1.02 | -0.54 | +0.47 | 9,172 |
| 114 | Sam Merrill | +0.40 | +0.06 | +0.47 | 4,276 |
| 115 |  Christian Braun | +0.80 | -0.33 | +0.47 | 8,640 |
| 116 |  Paolo Banchero | +0.14 | +0.32 | +0.46 | 9,251 |
| 117 |  Precious Achiuwa | +0.71 | -0.26 | +0.45 | 5,539 |
| 118 |  Torrey Craig | +0.54 | -0.09 | +0.45 | 3,892 |
| 119 |  Max Strus | +0.31 | +0.14 | +0.45 | 7,840 |
| 120 |  Jevon Carter | +0.41 | +0.03 | +0.43 | 3,811 |
Three-season window anchored on the season shown, weighted 100 / 70 / 49%. Expected points per 100 possessions. Minimum 2,000 weighted possessions.
Like a normal RAPM, you can then decompose this further into offensive xPTS-RAPM (oxRAPM) and defensive xPTS-RAPM (dxRAPM): how a player changes the geometry of the court to bend his team toward more favorable shot conditions, and how his presence helps suppress favorable shot conditions on the other side. I show the best offenders and defenders below.
As you may notice, Donovan Clingan and the Thompson twins are amongst the most surprising and notable leaders, especially since they are not good three-point shooters, nor are they playmakers. I will have to do more decomposition to see, numerically, why they rank so well.
| # | Player | Defense | Poss |
|---|---|---|---|
| 1 | Bam Adebayo | +2.07 | 10,758 |
| 2 | Draymond Green | +1.72 | 7,999 |
| 3 | Domantas Sabonis | +1.61 | 7,448 |
| 4 | Kris Dunn | +1.60 | 8,064 |
| 5 | Rudy Gobert | +1.52 | 10,395 |
| 6 | Franz Wagner | +1.51 | 7,064 |
| 7 | Derrick White | +1.44 | 10,867 |
| 8 | Jalen Suggs | +1.42 | 6,599 |
| 9 | Brandin Podziemski | +1.41 | 8,832 |
| 10 | Isaiah Hartenstein | +1.39 | 6,355 |
| 11 | Kawhi Leonard | +1.37 | 7,942 |
| 12 |  Ivica Zubac | +1.36 | 8,195 |
| 13 | Cade Cunningham | +1.25 | 9,844 |
| 14 | Ausar Thompson | +1.21 | 7,140 |
| 15 | Wendell Carter Jr. | +1.18 | 8,298 |
| 16 | Alex Caruso | +1.14 | 5,469 |
| 17 | Dyson Daniels | +1.14 | 10,172 |
| 18 | Donovan Clingan | +1.10 | 6,024 |
| 19 | Jimmy Butler III | +1.08 | 6,617 |
| 20 | Nikola Jokić | +1.02 | 10,851 |
| 21 |  Marcus Smart | +1.00 | 5,065 |
| 22 |  Deandre Ayton | +0.98 | 7,199 |
| 23 | Kentavious Caldwell-Pope | +0.95 | 7,559 |
| 24 |  Jusuf Nurkić | +0.94 | 5,704 |
| 25 | Dillon Brooks | +0.93 | 8,836 |
| 26 |  Jalen Duren | +0.93 | 8,537 |
| 27 | Victor Wembanyama | +0.93 | 7,985 |
| 28 | Austin Reaves | +0.93 | 9,596 |
| 29 | Derrick Jones Jr. | +0.92 | 7,060 |
| 30 |  Paul George | +0.92 | 6,494 |
| 31 |  Jonathan Kuminga | +0.92 | 5,167 |
| 32 |  Keegan Murray | +0.91 | 7,742 |
| 33 |  Ajay Mitchell | +0.91 | 3,821 |
| 34 | Moses Moody | +0.86 | 6,469 |
| 35 |  Cason Wallace | +0.86 | 8,426 |
| 36 |  Jrue Holiday | +0.83 | 7,942 |
| 37 | Toumani Camara | +0.82 | 10,702 |
| 38 | Stephen Curry | +0.82 | 8,328 |
| 39 | Mike Conley | +0.78 | 6,437 |
| 40 | 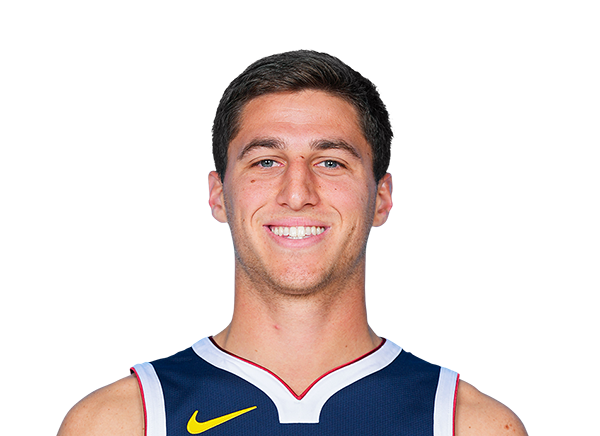 Collin Gillespie | +0.78 | 5,301 |
| 41 | Jonathan Isaac | +0.77 | 3,314 |
| 42 | Anthony Black | +0.77 | 7,448 |
| 43 | Keon Ellis | +0.76 | 6,518 |
| 44 | Gary Payton II | +0.75 | 4,195 |
| 45 |  Tyrese Martin | +0.75 | 3,252 |
| 46 |  Pelle Larsson | +0.74 | 4,917 |
| 47 |  Jalen Williams | +0.74 | 7,341 |
| 48 | Javonte Green | +0.72 | 4,876 |
| 49 |  Andrew Wiggins | +0.71 | 8,738 |
| 50 | Jakob Poeltl | +0.71 | 5,944 |
| 51 |  Chet Holmgren | +0.70 | 7,689 |
| 52 | Fred VanVleet | +0.67 | 5,475 |
| 53 | Luke Kornet | +0.67 | 5,565 |
| 54 |  Zach Edey | +0.67 | 2,622 |
| 55 |  Nique Clifford | +0.66 | 3,718 |
| 56 |  Neemias Queta | +0.64 | 5,106 |
| 57 |  De'Anthony Melton | +0.63 | 3,354 |
| 58 |  Matisse Thybulle | +0.63 | 2,835 |
| 59 | Anthony Davis | +0.62 | 6,245 |
| 60 |  Brook Lopez | +0.62 | 9,124 |
| 61 | Caleb Martin | +0.59 | 4,990 |
| 62 | Herbert Jones | +0.57 | 6,327 |
| 63 |  Haywood Highsmith | +0.57 | 3,919 |
| 64 | Amen Thompson | +0.56 | 10,091 |
| 65 | Luka Dončić | +0.55 | 9,610 |
| 66 | OG Anunoby | +0.54 | 9,671 |
| 67 |  Sion James | +0.53 | 3,554 |
| 68 | Paul Reed | +0.53 | 3,878 |
| 69 | Trayce Jackson-Davis | +0.53 | 3,387 |
| 70 | Gary Harris | +0.51 | 3,458 |
| 71 |  Al Horford | +0.51 | 5,812 |
| 72 |  Norman Powell | +0.51 | 8,305 |
| 73 | Larry Nance Jr. | +0.51 | 2,728 |
| 74 | Goga Bitadze | +0.50 | 4,744 |
| 75 | 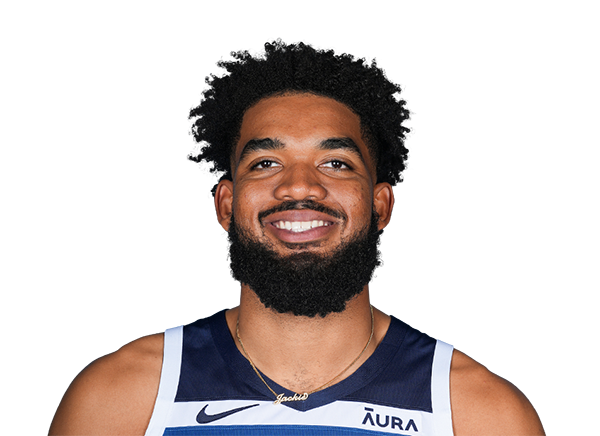 Karl-Anthony Towns | +0.48 | 10,011 |
| 76 | Kenrich Williams | +0.47 | 4,255 |
| 77 |  Mouhamed Gueye | +0.47 | 3,181 |
| 78 |  Daniss Jenkins | +0.47 | 2,907 |
| 79 | Trey Lyles | +0.47 | 2,956 |
| 80 |  Pat Spencer | +0.47 | 2,776 |
| 81 | Dereck Lively II | +0.46 | 2,670 |
| 82 | Jarrett Allen | +0.46 | 8,666 |
| 83 | Lauri Markkanen | +0.46 | 6,875 |
| 84 |  Rui Hachimura | +0.46 | 8,190 |
| 85 | John Konchar | +0.45 | 4,221 |
| 86 |  Gui Santos | +0.44 | 3,978 |
| 87 |  Jaylen Wells | +0.44 | 6,679 |
| 88 | Precious Achiuwa | +0.42 | 6,556 |
| 89 |  Mark Williams | +0.41 | 4,978 |
| 90 |  Tristan da Silva | +0.41 | 5,977 |
| 91 |  Sidy Cissoko | +0.41 | 3,137 |
| 92 |  Jonas Valančiūnas | +0.41 | 5,668 |
| 93 | Kevin Huerter | +0.41 | 7,087 |
| 94 |  Onyeka Okongwu | +0.41 | 9,146 |
| 95 | Luguentz Dort | +0.40 | 8,900 |
| 96 |  Duncan Robinson | +0.40 | 8,459 |
| 97 | LeBron James | +0.40 | 9,697 |
| 98 |  Jaylin Williams | +0.40 | 4,560 |
| 99 | Steven Adams | +0.39 | 2,471 |
| 100 | Kevin Love | +0.39 | 2,510 |
| 101 | Kyle Lowry | +0.39 | 2,728 |
| 102 | LaMelo Ball | +0.38 | 6,805 |
| 103 | Aaron Gordon | +0.37 | 6,188 |
| 104 | Dwight Powell | +0.37 | 3,432 |
| 105 | Kevon Looney | +0.37 | 3,321 |
| 106 | Kon Knueppel | +0.36 | 5,060 |
| 107 | Jayson Tatum | +0.36 | 7,129 |
| 108 |  Svi Mykhailiuk | +0.36 | 3,828 |
| 109 |  Andrew Nembhard | +0.36 | 7,955 |
| 110 |  Jarred Vanderbilt | +0.36 | 3,554 |
| 111 |  Ronald Holland II | +0.35 | 4,822 |
| 112 |  Myles Turner | +0.35 | 8,937 |
| 113 |  Ryan Kalkbrenner | +0.35 | 2,957 |
| 114 | Payton Pritchard | +0.34 | 9,594 |
| 115 | Donovan Mitchell | +0.34 | 9,808 |
| 116 |  Brandon Miller | +0.34 | 7,395 |
| 117 | Dean Wade | +0.34 | 5,431 |
| 118 |  AJ Green | +0.34 | 7,368 |
| 119 | Pascal Siakam | +0.33 | 10,357 |
| 120 |  Terry Rozier | +0.31 | 4,212 |
Same solve, decomposed. Offense is the effect on his own team’s expected points; defense is how much he suppresses his opponent’s. Positive is better on both ends. Minimum 2,000 weighted possessions.
These leaders are actually a great case study of what this RAPM measures. Clingan is a chance-quality machine in three distinct ways. His rebounding: 22.2 offensive rebounds per 100 shots is a good 30% more than league average. Many of those rebounds convert a dead possession into a putback or a kick-out, which sit amongst the most highly priced bins, around 1.3 to 1.5 expected points. And his rebounding lets Portland manufacture its diet: with him on the court, Portland takes 39% of its shots from three and 26% at the rim, while opponents get only 22% of their shots at the rim. Portland’s offense with Clingan on is extremely Morey-pilled: rim attempt or three-point attempt.
For the Thompson twins, Amen is actually the best offensive geometry-bender in the league. He is the offensive xPTS engine: extreme rim pressure and second chances. Remember, with expected points there is no tax, no punishment for his lack of conversion, or his team’s, while he is on the court.
Ausar, meanwhile, is elite defensively. His presence lets his team take 28% of its shots at the rim while dropping opponents’ rim share to about 19%, and he forces about 19 turnovers per 100, zeroing out those possessions entirely.
On the inverse, you have the players who perform extremely poorly in net xPTS-RAPM. The worst is Bub Carrington, and the interesting point about him is that there is no single horrific channel. He is simply poor among so many. Washington’s offense becomes extremely midrange-heavy when he is on the court: his personal game is heavily pull-up-weighted with no rim pressure, which drags Washington into the cheapest quantified shot values. He provides no transition boost, below-average offensive rebounding, and above-average turnovers, essentially never generating or forcing his team toward more optimal chances while leaking possessions along the way. 26% of opponents’ shots come at the rim with him on, against a league average of about 21%, while the opponents take only 20% from midrange, the exact inverse of what a good defense produces. He does not create turnovers. He gives up straight drives to the rim, and opponents’ free-throw share runs above average. Some honest context, which I will return to in the caveats: he plays for a 17-win team that has been bad as an entire unit, he is a young guard given developmental freedom and reps, and the collinearity weakness of any ridge regression does exist.Kevin Durant and net xPTS-RAPM is a very interesting story, especially when you pair it with his conversion. His shot-quality impact is among the single worst in the entire league. He provides no rim pressure, there is no transition game, the offense becomes a half-court jousting match every possession. His influence turns his team into a midrange engine, the quantified worst shot in basketball, at roughly 7% more than league average.
He still rates well in all RAPMs, because he is, even at his age, among the most elite converters in the sport. As you saw from the earlier tables: 315 points made above expected this season, 280 the season before. He makes the poorly graded 8-to-10-foot pull-ups at about 1.21 expected points versus a league average of 0.94, functionally making what is graded as the worst shot in basketball worth more than a three from a league-average shooter. He ranks in the 1st percentile of the league in chance creation and the 100th percentile in conversion. Extreme dimorphism.
And that, as I will keep touching on, is the beauty of xPTS and xPTS-RAPM. You can now decompose what RAPM even stands for in a new way: how many chances a player creates or suppresses through the geometry of the floor, versus how much he converts himself, or erases.
The beauty of xPTS-RAPM is that it is subtly a decomposition channel of RAPM itself: one half of a shot-quality decomposition. xPTS-RAPM is the half that measures how many chances a player creates or suppresses through the geometry of the floor. Its sister, Conversion RAPM, measures how much his presence helps convert, or deny, shots above expected. The summation of the two gets you net RAPM, the standard RAPM we all know and love, the one that measures how team net rating moves with a player on or off the court.
His geometry costs his team about a point and a half of chance quality per 100; his shot-making pays it back twice over. Positive is better on both ends.
Conversion RAPM
xPTS-RAPM: a quantification of how a player influences his team’s shot diet. Conversion RAPM: a quantification of how a player’s on-court influence alters the points created above expected.
| # | Player | Off | Def | Net Conversion RAPM | Poss |
|---|---|---|---|---|---|
| 1 | Shai Gilgeous-Alexander | +2.50 | +1.91 | +4.41 | 10,859 |
| 2 | Kevin Durant | +3.08 | +0.01 | +3.08 | 11,329 |
| 3 | Kawhi Leonard | +2.67 | +0.40 | +3.07 | 7,942 |
| 4 | Nikola Jokić | +3.07 | -0.20 | +2.87 | 10,851 |
| 5 | Derrick White | +1.80 | +0.95 | +2.75 | 10,867 |
| 6 | Chet Holmgren | +1.06 | +1.62 | +2.68 | 7,689 |
| 7 | Jamal Murray | +3.03 | -0.40 | +2.64 | 10,422 |
| 8 | Victor Wembanyama | +0.27 | +2.02 | +2.29 | 7,985 |
| 9 |  Devin Booker | +1.70 | +0.54 | +2.24 | 10,511 |
| 10 | Luka Dončić | +2.36 | -0.15 | +2.21 | 9,610 |
| 11 | Jarrett Allen | +1.59 | +0.48 | +2.07 | 8,666 |
| 12 |  Tyrese Haliburton | +1.81 | +0.12 | +1.93 | 5,732 |
| 13 |  Peyton Watson | +0.83 | +1.08 | +1.90 | 6,808 |
| 14 |  Nickeil Alexander-Walker | +0.88 | +1.00 | +1.88 | 10,044 |
| 15 | Sam Hauser | +1.64 | +0.24 | +1.88 | 7,422 |
| 16 |  Joel Embiid | +0.84 | +1.01 | +1.85 | 4,472 |
| 17 | OG Anunoby | +0.89 | +0.96 | +1.85 | 9,671 |
| 18 | Jaylin Williams | +0.78 | +1.06 | +1.84 | 4,560 |
| 19 | Kyrie Irving | +1.15 | +0.69 | +1.84 | 4,532 |
| 20 |  Isaiah Joe | +0.89 | +0.92 | +1.81 | 6,752 |
| 21 | Neemias Queta | +0.80 | +0.95 | +1.75 | 5,106 |
| 22 | Kon Knueppel | +1.55 | +0.16 | +1.71 | 5,060 |
| 23 | Stephen Curry | +2.84 | -1.14 | +1.70 | 8,328 |
| 24 | Rui Hachimura | +1.49 | +0.20 | +1.70 | 8,190 |
| 25 | Giannis Antetokounmpo | +0.99 | +0.71 | +1.70 | 7,723 |
| 26 | Donovan Mitchell | +1.15 | +0.50 | +1.65 | 9,808 |
| 27 | Anthony Edwards | +1.55 | +0.09 | +1.64 | 10,861 |
| 28 | CJ McCollum | +0.80 | +0.84 | +1.64 | 9,283 |
| 29 |  Luke Kennard | +1.86 | -0.23 | +1.64 | 6,443 |
| 30 | Brook Lopez | +1.10 | +0.54 | +1.64 | 9,124 |
| 31 |  Nicolas Batum | +0.58 | +0.95 | +1.53 | 5,848 |
| 32 |  Ryan Rollins | +0.96 | +0.56 | +1.52 | 5,884 |
| 33 | 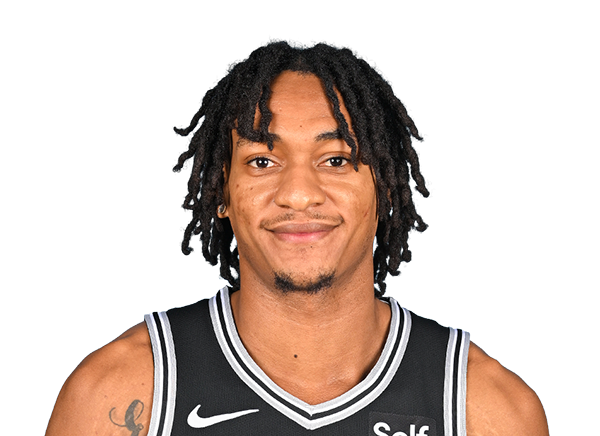 Devin Vassell | +0.76 | +0.74 | +1.50 | 9,176 |
| 34 |  Donte DiVincenzo | +0.23 | +1.26 | +1.50 | 9,462 |
| 35 | Aaron Nesmith | +1.19 | +0.27 | +1.46 | 6,312 |
| 36 | 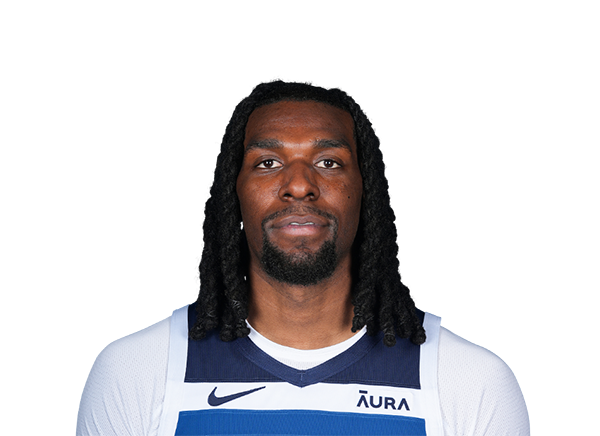 Naz Reid | +0.34 | +1.09 | +1.43 | 8,948 |
| 37 | Jaylen Brown | +1.71 | -0.29 | +1.42 | 10,016 |
| 38 | Karl-Anthony Towns | +1.46 | -0.05 | +1.41 | 10,011 |
| 39 |  Coby White | +0.87 | +0.54 | +1.41 | 8,802 |
| 40 |  Darius Garland | +1.29 | +0.12 | +1.41 | 7,825 |
| 41 | Julius Randle | +1.20 | +0.21 | +1.41 | 9,829 |
| 42 | Dorian Finney-Smith | +0.49 | +0.90 | +1.39 | 5,508 |
| 43 | Jayson Tatum | +0.86 | +0.52 | +1.38 | 7,129 |
| 44 |  Ty Jerome | +1.41 | -0.06 | +1.35 | 2,651 |
| 45 |  Oso Ighodaro | +0.44 | +0.88 | +1.32 | 4,922 |
| 46 | Aaron Gordon | +0.48 | +0.80 | +1.28 | 6,188 |
| 47 | Duncan Robinson | +0.87 | +0.41 | +1.28 | 8,459 |
| 48 |  Malik Beasley | +0.93 | +0.35 | +1.28 | 5,559 |
| 49 | Damian Lillard | +0.43 | +0.85 | +1.28 | 5,478 |
| 50 | Zach Edey | +0.66 | +0.62 | +1.28 | 2,622 |
| 51 | Ivica Zubac | +1.14 | +0.13 | +1.27 | 8,195 |
| 52 |  Bobby Portis | +1.24 | +0.02 | +1.26 | 6,803 |
| 53 | Dean Wade | -0.01 | +1.25 | +1.24 | 5,431 |
| 54 |  Hugo González | +0.75 | +0.48 | +1.23 | 2,069 |
| 55 | Marcus Smart | +0.45 | +0.78 | +1.22 | 5,065 |
| 56 |  Ryan Nembhard | +0.73 | +0.49 | +1.22 | 2,308 |
| 57 | Christian Braun | +0.45 | +0.76 | +1.21 | 8,091 |
| 58 |  Cedric Coward | +0.91 | +0.28 | +1.20 | 3,272 |
| 59 | AJ Green | +1.09 | +0.09 | +1.18 | 7,368 |
| 60 | Rudy Gobert | -0.64 | +1.81 | +1.17 | 10,395 |
| 61 | Norman Powell | +0.57 | +0.60 | +1.17 | 8,305 |
| 62 |  Davion Mitchell | +0.25 | +0.90 | +1.15 | 8,003 |
| 63 |  D'Angelo Russell | +0.26 | +0.88 | +1.14 | 5,497 |
| 64 | Zach LaVine | +1.12 | +0.01 | +1.13 | 6,981 |
| 65 | Kevin Huerter | +0.68 | +0.44 | +1.12 | 7,087 |
| 66 | Tobias Harris | -0.07 | +1.18 | +1.11 | 8,984 |
| 67 | Myles Turner | +0.78 | +0.32 | +1.10 | 8,937 |
| 68 | Sam Merrill | +0.27 | +0.82 | +1.09 | 5,718 |
| 69 | Payton Pritchard | +1.46 | -0.37 | +1.09 | 9,594 |
| 70 | Jrue Holiday | +0.29 | +0.80 | +1.09 | 7,942 |
| 71 |  Eric Gordon | +0.59 | +0.49 | +1.08 | 3,020 |
| 72 | Paul George | +0.76 | +0.32 | +1.08 | 6,494 |
| 73 | Al Horford | +1.08 | -0.01 | +1.08 | 5,812 |
| 74 |  Daniel Gafford | +0.04 | +1.01 | +1.05 | 5,949 |
| 75 | Jimmy Butler III | +1.07 | -0.04 | +1.03 | 6,617 |
| 76 | Pascal Siakam | +0.77 | +0.25 | +1.02 | 10,357 |
| 77 |  Julian Champagnie | +0.46 | +0.56 | +1.01 | 8,798 |
| 78 |  Nikola Vučević | +0.70 | +0.31 | +1.01 | 9,485 |
| 79 |  Reed Sheppard | +0.54 | +0.45 | +0.99 | 5,142 |
| 80 |  Jaren Jackson Jr. | -0.47 | +1.46 | +0.99 | 8,259 |
| 81 |  Aaron Holiday | -0.08 | +1.05 | +0.97 | 3,838 |
| 82 | Brandon Ingram | +0.74 | +0.22 | +0.96 | 7,989 |
| 83 | Brandon Miller | +0.64 | +0.32 | +0.96 | 7,395 |
| 84 | Isaiah Hartenstein | +0.31 | +0.65 | +0.96 | 6,355 |
| 85 | Austin Reaves | +1.39 | -0.43 | +0.96 | 9,596 |
| 86 |  Aaron Wiggins | +0.18 | +0.78 | +0.95 | 6,518 |
| 87 |  Tyrese Maxey | +0.09 | +0.86 | +0.95 | 10,520 |
| 88 | Moussa Diabaté | +0.39 | +0.55 | +0.94 | 5,350 |
| 89 | Alex Caruso | -0.27 | +1.21 | +0.94 | 5,469 |
| 90 |  Jay Huff | -0.16 | +1.10 | +0.94 | 4,642 |
| 91 | Dyson Daniels | +0.59 | +0.34 | +0.94 | 10,172 |
| 92 | Dereck Lively II | +0.49 | +0.44 | +0.93 | 2,670 |
| 93 | Luguentz Dort | +0.66 | +0.26 | +0.92 | 8,900 |
| 94 |  Robert Williams III | -0.23 | +1.15 | +0.92 | 2,615 |
| 95 |  Tyler Herro | +1.25 | -0.35 | +0.90 | 7,200 |
| 96 |  Naji Marshall | +0.29 | +0.60 | +0.89 | 8,281 |
| 97 | Evan Mobley | +0.04 | +0.85 | +0.89 | 8,702 |
| 98 |  Jalen Pickett | -0.08 | +0.96 | +0.89 | 2,568 |
| 99 | Jalen Williams | +0.53 | +0.35 | +0.88 | 7,341 |
| 100 | De'Aaron Fox | +0.85 | +0.03 | +0.88 | 10,310 |
| 101 |  Grant Williams | +0.52 | +0.35 | +0.87 | 4,107 |
| 102 | Herbert Jones | +0.22 | +0.63 | +0.85 | 6,327 |
| 103 |  Maxi Kleber | +0.67 | +0.17 | +0.84 | 2,631 |
| 104 |  Kristaps Porziņģis | +0.22 | +0.60 | +0.82 | 4,908 |
| 105 |  Jose Alvarado | -0.39 | +1.21 | +0.82 | 5,518 |
| 106 |  Josh Giddey | +0.25 | +0.57 | +0.82 | 8,680 |
| 107 |  Jalen Smith | +0.26 | +0.55 | +0.81 | 4,676 |
| 108 | James Harden | +1.31 | -0.51 | +0.80 | 11,017 |
| 109 |  Desmond Bane | +0.76 | +0.04 | +0.80 | 10,191 |
| 110 |  Jaden McDaniels | +0.25 | +0.55 | +0.80 | 10,215 |
| 111 |  Baylor Scheierman | +0.37 | +0.42 | +0.79 | 3,235 |
| 112 | Ajay Mitchell | +0.13 | +0.67 | +0.79 | 3,821 |
| 113 |  Klay Thompson | +0.23 | +0.50 | +0.72 | 8,069 |
| 114 | Jalen Brunson | +0.94 | -0.24 | +0.70 | 10,778 |
| 115 | Derrick Jones Jr. | +0.71 | -0.04 | +0.68 | 7,060 |
| 116 |  Tre Johnson | +0.51 | +0.14 | +0.66 | 2,997 |
| 117 |  Karlo Matković | -0.37 | +1.01 | +0.64 | 2,928 |
| 118 | Kenrich Williams | +0.55 | +0.09 | +0.64 | 4,255 |
| 119 |  Julian Phillips | -0.11 | +0.75 | +0.64 | 2,800 |
| 120 |  Royce O'Neale | +0.71 | -0.09 | +0.62 | 8,805 |
Points above expected per 100 possessions, on versus off. Same three-season window, same solve, different target. Minimum 2,000 weighted possessions.
| Rim lg 1.344 | Midrange lg 0.873 | Three lg 1.081 | |
|---|---|---|---|
| Wembanyama | 1.209 (−0.135) | 0.749 (−0.124) | 1.060 (−0.021) |
| Gobert | 1.289 (−0.055) | 0.799 (−0.074) | 1.036 (−0.045) |
| Caruso | 1.217 (−0.127) | 0.735 (−0.138) | 1.050 (−0.031) |
Opponent points per attempt with each player on the floor, 2025–26 league baselines in the header. Parentheses show the suppression versus baseline.
Net RAPM
After running numeric validation, I found that I had somehow built, from first principles, a full reconstruction of pure RAPM. Using my own expected-points measure for shot values, and the conversion above or below those shot values, adding the two regularized adjusted plus-minuses together gives you a number that is 99.99999% equivalent to a pure, no-prior RAPM.
This is the part I am extremely excited for: to my knowledge, this is the first public and open exact decomposition of pure RAPM.
Standard pure RAPM asks what happens to the score: how does net rating change with this player on and off the court?
I take that question and rip it into two further questions. How much does this player change his team’s quantified shot diet? And how much does his presence swing his team’s conversion above or below that shot diet? Essentially, separating regularized adjusted plus-minus into shot-quality impact and conversion impact.
The identity requires the same RAPM specification in all three solves: the same stint rows, lineup matrix, stint weights, centering, and ridge penalty. Another researcher can use different stints or a different xPTS model and still recover the same identity inside that specification, as long as conversion is defined as actual points minus expected points and all three solves use the same settings.
And boom: this is the table of both aforementioned RAPMs added together to get the net per-100 RAPM that we all know and love, the one reconstructing net rating. Essentially, what I have done over the past couple of sections is backwards-decompose it.
| # | Player | Net RAPM | xPTS-RAPM | Conversion | Pure RAPM | Poss |
|---|---|---|---|---|---|---|
| 1 | Nikola Jokić | +5.52 | +2.65 | +2.87 | +5.52 | 10,851 |
| 2 | Shai Gilgeous-Alexander | +5.25 | +0.84 | +4.41 | +5.25 | 10,859 |
| 3 | Kawhi Leonard | +4.02 | +0.94 | +3.07 | +4.01 | 7,942 |
| 4 | Victor Wembanyama | +3.96 | +1.67 | +2.29 | +3.96 | 7,985 |
| 5 | Giannis Antetokounmpo | +3.86 | +2.17 | +1.70 | +3.86 | 7,723 |
| 6 | Derrick White | +3.77 | +1.02 | +2.75 | +3.77 | 10,867 |
| 7 | Chet Holmgren | +3.40 | +0.73 | +2.68 | +3.40 | 7,689 |
| 8 | Luka Dončić | +3.17 | +0.96 | +2.21 | +3.17 | 9,610 |
| 9 | Rudy Gobert | +3.03 | +1.85 | +1.17 | +3.03 | 10,395 |
| 10 | Donovan Mitchell | +2.94 | +1.29 | +1.65 | +2.94 | 9,808 |
| 11 | Alex Caruso | +2.87 | +1.92 | +0.94 | +2.87 | 5,469 |
| 12 | OG Anunoby | +2.86 | +1.01 | +1.85 | +2.86 | 9,671 |
| 13 | Isaiah Hartenstein | +2.79 | +1.82 | +0.96 | +2.78 | 6,355 |
| 14 | Jimmy Butler III | +2.69 | +1.66 | +1.03 | +2.69 | 6,617 |
| 15 | Moussa Diabaté | +2.67 | +1.72 | +0.94 | +2.67 | 5,350 |
| 16 | Amen Thompson | +2.59 | +2.37 | +0.21 | +2.59 | 10,091 |
| 17 | Jarrett Allen | +2.56 | +0.50 | +2.07 | +2.56 | 8,666 |
| 18 | Dyson Daniels | +2.52 | +1.59 | +0.94 | +2.52 | 10,172 |
| 19 | Franz Wagner | +2.50 | +2.32 | +0.17 | +2.50 | 7,064 |
| 20 | Dean Wade | +2.49 | +1.25 | +1.24 | +2.49 | 5,431 |
| 21 | Neemias Queta | +2.47 | +0.72 | +1.75 | +2.47 | 5,106 |
| 22 | Aaron Gordon | +2.33 | +1.05 | +1.28 | +2.33 | 6,188 |
| 23 | Tobias Harris | +2.32 | +1.21 | +1.11 | +2.32 | 8,984 |
| 24 | Ausar Thompson | +2.30 | +2.27 | +0.04 | +2.30 | 7,140 |
| 25 | De'Aaron Fox | +2.21 | +1.33 | +0.88 | +2.21 | 10,310 |
| 26 | Jayson Tatum | +2.14 | +0.76 | +1.38 | +2.14 | 7,129 |
| 27 | Marcus Smart | +2.13 | +0.91 | +1.22 | +2.13 | 5,065 |
| 28 | Bam Adebayo | +2.12 | +1.97 | +0.15 | +2.12 | 10,758 |
| 29 | Nickeil Alexander-Walker | +2.07 | +0.19 | +1.88 | +2.07 | 10,044 |
| 30 | Kon Knueppel | +2.05 | +0.35 | +1.71 | +2.05 | 5,060 |
| 31 | Christian Braun | +2.05 | +0.84 | +1.21 | +2.05 | 8,091 |
| 32 | Jrue Holiday | +2.04 | +0.96 | +1.09 | +2.04 | 7,942 |
| 33 | Jamal Murray | +2.03 | -0.61 | +2.64 | +2.02 | 10,422 |
| 34 | Sam Hauser | +1.99 | +0.11 | +1.88 | +1.99 | 7,422 |
| 35 | Tari Eason | +1.98 | +1.48 | +0.50 | +1.98 | 5,423 |
| 36 | Tyrese Haliburton | +1.97 | +0.03 | +1.93 | +1.97 | 5,732 |
| 37 | Evan Mobley | +1.96 | +1.07 | +0.89 | +1.96 | 8,702 |
| 38 | Luke Kornet | +1.93 | +1.97 | -0.03 | +1.94 | 5,565 |
| 39 | Zach Edey | +1.85 | +0.57 | +1.28 | +1.85 | 2,622 |
| 40 | Duncan Robinson | +1.81 | +0.53 | +1.28 | +1.81 | 8,459 |
| 41 | Payton Pritchard | +1.81 | +0.72 | +1.09 | +1.81 | 9,594 |
| 42 | Stephen Curry | +1.80 | +0.10 | +1.70 | +1.80 | 8,328 |
| 43 | Karl-Anthony Towns | +1.80 | +0.39 | +1.41 | +1.80 | 10,011 |
| 44 | Steven Adams | +1.79 | +1.40 | +0.39 | +1.79 | 2,471 |
| 45 | Donte DiVincenzo | +1.77 | +0.27 | +1.50 | +1.77 | 9,462 |
| 46 | Brandin Podziemski | +1.76 | +1.79 | -0.04 | +1.76 | 8,832 |
| 47 | Norman Powell | +1.73 | +0.56 | +1.17 | +1.73 | 8,305 |
| 48 | Dylan Harper | +1.73 | +1.28 | +0.45 | +1.73 | 3,099 |
| 49 | Isaiah Joe | +1.73 | -0.09 | +1.81 | +1.73 | 6,752 |
| 50 | Jonathan Kuminga | +1.72 | +1.16 | +0.55 | +1.72 | 5,167 |
| 51 | Jaylin Williams | +1.71 | -0.13 | +1.84 | +1.71 | 4,560 |
| 52 | Julian Champagnie | +1.69 | +0.68 | +1.01 | +1.69 | 8,798 |
| 53 | Ajay Mitchell | +1.67 | +0.88 | +0.79 | +1.67 | 3,821 |
| 54 | Austin Reaves | +1.65 | +0.69 | +0.96 | +1.65 | 9,596 |
| 55 | Anthony Edwards | +1.60 | -0.04 | +1.64 | +1.60 | 10,861 |
| 56 | Miles McBride | +1.59 | +1.26 | +0.34 | +1.59 | 5,470 |
| 57 | Herbert Jones | +1.58 | +0.73 | +0.85 | +1.58 | 6,327 |
| 58 | Cade Cunningham | +1.57 | +1.71 | -0.14 | +1.57 | 9,844 |
| 59 | Dereck Lively II | +1.56 | +0.63 | +0.93 | +1.56 | 2,670 |
| 60 | Fred VanVleet | +1.56 | +1.15 | +0.41 | +1.56 | 5,475 |
| 61 | Dorian Finney-Smith | +1.56 | +0.17 | +1.39 | +1.56 | 5,508 |
| 62 | Joel Embiid | +1.55 | -0.30 | +1.85 | +1.55 | 4,472 |
| 63 | Devin Booker | +1.54 | -0.70 | +2.24 | +1.54 | 10,511 |
| 64 | Stephon Castle | +1.54 | +1.15 | +0.39 | +1.54 | 7,157 |
| 65 | Pascal Siakam | +1.53 | +0.51 | +1.02 | +1.53 | 10,357 |
| 66 | LaMelo Ball | +1.50 | +1.18 | +0.32 | +1.50 | 6,805 |
| 67 | Paul George | +1.50 | +0.42 | +1.08 | +1.50 | 6,494 |
| 68 | Hugo González | +1.49 | +0.26 | +1.23 | +1.49 | 2,069 |
| 69 | Jalen Brunson | +1.48 | +0.78 | +0.70 | +1.48 | 10,778 |
| 70 | Cason Wallace | +1.47 | +1.07 | +0.40 | +1.47 | 8,426 |
| 71 | Rui Hachimura | +1.42 | -0.27 | +1.70 | +1.42 | 8,190 |
| 72 | Paul Reed | +1.42 | +0.86 | +0.56 | +1.42 | 3,878 |
| 73 | Jalen Smith | +1.40 | +0.59 | +0.81 | +1.40 | 4,676 |
| 74 | Lauri Markkanen | +1.38 | +0.99 | +0.39 | +1.38 | 6,875 |
| 75 | Kevin Durant | +1.35 | -1.73 | +3.08 | +1.35 | 11,329 |
| 76 | Kevin Huerter | +1.35 | +0.23 | +1.12 | +1.34 | 7,087 |
| 77 | Sandro Mamukelashvili | +1.33 | +1.34 | -0.01 | +1.33 | 4,877 |
| 78 | Damian Lillard | +1.32 | +0.05 | +1.28 | +1.32 | 5,478 |
| 79 | Aaron Holiday | +1.30 | +0.33 | +0.97 | +1.30 | 3,838 |
| 80 | Jalen Suggs | +1.28 | +1.06 | +0.22 | +1.28 | 6,599 |
| 81 | Kyrie Irving | +1.28 | -0.56 | +1.84 | +1.28 | 4,532 |
| 82 | Julius Randle | +1.28 | -0.13 | +1.41 | +1.28 | 9,829 |
| 83 | Mikal Bridges | +1.25 | +0.77 | +0.48 | +1.25 | 12,119 |
| 84 | Sam Merrill | +1.25 | +0.16 | +1.09 | +1.25 | 5,718 |
| 85 | Ivica Zubac | +1.24 | -0.03 | +1.27 | +1.24 | 8,195 |
| 86 | Sion James | +1.24 | +0.68 | +0.56 | +1.24 | 3,554 |
| 87 | Naz Reid | +1.20 | -0.23 | +1.43 | +1.20 | 8,948 |
| 88 | Mitchell Robinson | +1.18 | +1.39 | -0.21 | +1.18 | 3,329 |
| 89 | Donovan Clingan | +1.18 | +2.67 | -1.49 | +1.18 | 6,024 |
| 90 | Wendell Carter Jr. | +1.14 | +0.94 | +0.21 | +1.14 | 8,298 |
| 91 | Oso Ighodaro | +1.14 | -0.19 | +1.32 | +1.14 | 4,922 |
| 92 | Davion Mitchell | +1.14 | -0.01 | +1.15 | +1.14 | 8,003 |
| 93 | Derrick Jones Jr. | +1.13 | +0.46 | +0.68 | +1.13 | 7,060 |
| 94 | Jalen Duren | +1.13 | +1.48 | -0.35 | +1.13 | 8,537 |
| 95 | Luguentz Dort | +1.12 | +0.20 | +0.92 | +1.12 | 8,900 |
| 96 | Collin Gillespie | +1.12 | +0.58 | +0.53 | +1.12 | 5,301 |
| 97 |  Cameron Johnson | +1.11 | +0.70 | +0.41 | +1.11 | 7,279 |
| 98 | Jalen Williams | +1.11 | +0.22 | +0.88 | +1.11 | 7,341 |
| 99 | Kenrich Williams | +1.10 | +0.46 | +0.64 | +1.10 | 4,255 |
| 100 | Josh Okogie | +1.10 | +1.12 | -0.03 | +1.10 | 4,294 |
| 101 | D'Angelo Russell | +1.08 | -0.05 | +1.14 | +1.08 | 5,497 |
| 102 | Aaron Nesmith | +1.06 | -0.40 | +1.46 | +1.06 | 6,312 |
| 103 | Clint Capela | +1.05 | +1.16 | -0.10 | +1.05 | 5,368 |
| 104 | Desmond Bane | +1.02 | +0.22 | +0.80 | +1.02 | 10,191 |
| 105 | Toumani Camara | +1.02 | +1.70 | -0.68 | +1.02 | 10,702 |
| 106 | Kris Dunn | +1.01 | +0.74 | +0.27 | +1.01 | 8,064 |
| 107 | Al Horford | +1.00 | -0.08 | +1.08 | +1.00 | 5,812 |
| 108 | Malik Beasley | +0.99 | -0.29 | +1.28 | +0.99 | 5,559 |
| 109 | De'Anthony Melton | +0.98 | +0.65 | +0.34 | +0.98 | 3,354 |
| 110 | Ja Morant | +0.98 | +0.47 | +0.50 | +0.98 | 3,737 |
| 111 | Jaylen Brown | +0.96 | -0.46 | +1.42 | +0.96 | 10,016 |
| 112 | Brook Lopez | +0.96 | -0.67 | +1.64 | +0.96 | 9,124 |
| 113 | Ty Jerome | +0.96 | -0.39 | +1.35 | +0.96 | 2,651 |
| 114 | Kristaps Porziņģis | +0.96 | +0.13 | +0.82 | +0.96 | 4,908 |
| 115 | RJ Barrett | +0.95 | +0.89 | +0.06 | +0.95 | 7,883 |
| 116 | Josh Hart | +0.94 | +1.02 | -0.07 | +0.94 | 10,369 |
| 117 | Alperen Sengun | +0.94 | +1.23 | -0.29 | +0.94 | 9,900 |
| 118 | CJ McCollum | +0.92 | -0.72 | +1.64 | +0.92 | 9,283 |
| 119 | Pelle Larsson | +0.91 | +1.22 | -0.30 | +0.91 | 4,917 |
| 120 |  Jabari Smith Jr. | +0.91 | +0.52 | +0.39 | +0.91 | 9,932 |
Pure RAPM is a separate ridge solve on actual points: same stint rows, lineup matrix, weights, centering, and α = 10,000; no priors. Before display rounding, the largest net difference is under 0.000000000024 points per 100 in both windows. Minimum 2,000 weighted possessions.
ClinganJokićDurantClingan, Jokić, Durant. Elite creation with no conversion; elite at both; elite conversion with no creation. Positive is better on both ends.
It is repeatable with any approach to expected-points shot quality and the conversion above or below it. Price the shots however you like; if you keep the same stints and the same regression, the two halves will reassemble into a healthy RAPM every time.
| Validation | Agreement | Players |
|---|---|---|
| xPTS-RAPM + Conversion RAPM vs pure RAPM | r = 0.9999999 | 802 |
| Net RAPM vs xrapm.com’s pure three-year RAPM, independent, no priors | r = 0.90 | 251 |
| Net RAPM vs ARC Impact, 3yr, light box prior | r = 0.95 | 364 |
| Net RAPM vs a single-season RAPM, separate pipeline | r = 0.85 | 262 |
Pure RAPM: same stints, same weights, same α, actual points as the target, no priors. The external rows are separately built metrics from different pipelines.
| Net RAPM percentile | xrapm.com percentile | |
|---|---|---|
| Jokić | 99th | 99th |
| Wembanyama | 99th | 99th |
| Dončić | 98th | 96th |
| Gobert | 98th | 94th |
| Brunson | 84th | 85th |
| Durant | 82nd | 90th |
| Şengün | 72nd | 89th |
| Portis | 29th | 38th |
| LaVine | 19th | 35th |
| Kuzma | 1st | 4th |
| Carrington | 1st | 0th |
League percentile in each system’s own qualified pool: this paper’s Net RAPM against xrapm.com’s pure, no-prior, three-year RAPM. Two independent solves, different code, different ridge settings, a mean gap of about five percentile points top to bottom.
Some caveats on xPTS-RAPM specifically: the health of the final number depends on the health of the inputs, the stints, and the math itself. And the match is to pure RAPM under the same specification; this is a three-year, recency-weighted solve, so it will not line up one-for-one with public boards built on other windows or priors. It does, though, match closely in leaderboard and rankings to my own impact metric, ARC Impact, a lightly box-priored RAPM, at 0.95. And against the closest public analogue, xrapm.com’s pure no-prior three-year RAPM, it agrees at a rank correlation of 0.91; they grade Durant at +1.8 to my +1.35, two independent pure solves telling the same story.
Everything Built Here
xPTSExpected point value of each field goal and free throw attempt, priced against league average.
CLEEvery field goal attempt priced by the 2025–26 league bin table; every free throw at the league rate of 0.78. Play-by-play context approximated from public data.
Total xPTSThe player currency: xPTS scored plus xPTS created, summed into X Score.
Personal-baseline xPTSThe same pricing computed from a player’s own history in each bin.
Expected WinsEach game awarded to the team that generated more net xPTS.
xPTS-RAPMA two-sided ridge regression measuring how a player changes the expected value of each shot.
| # | Player | Off | Def | Net xPTS-RAPM | Poss |
|---|
Three-season window anchored on the season shown, weighted 100 / 70 / 49%. Expected points per 100 possessions. Minimum 2,000 weighted possessions.
Conversion RAPMThe same regression on points scored above expected.
| # | Player | Off | Def | Net Conversion RAPM | Poss |
|---|
Points above expected per 100 possessions, on versus off. Same three-season window, same solve, different target. Minimum 2,000 weighted possessions.
Net RAPMxPTS-RAPM plus Conversion RAPM, which reconstructs pure RAPM exactly.
| # | Player | Net RAPM | xPTS-RAPM | Conversion | Pure RAPM | Poss |
|---|
Pure RAPM is a separate ridge solve on actual points: same stint rows, lineup matrix, weights, centering, and α = 10,000; no priors. Before display rounding, the largest net difference is under 0.000000000024 points per 100 in both windows. Minimum 2,000 weighted possessions.
ClinganJokićClingan and Jokić, decomposed. Same elite chance creation, opposite conversion. Positive is better on both ends.
Caveats
- The 2015–16 work is unfinished. The leak gave me roughly 25% of that season’s defender-distance data, 295 of 1,230 games. Everything built on it is a projected sample, not a season.
- The main formulation has no defender distance. The 707-bin engine captures about 77% of the value found in defender distance. I lose roughly 23% of real shot-quality information, at the lowest. My xPTS is unfinished until I get real defender-distance data. Treat this as a working proof of concept.
- The bins are trained per season. Each season’s 707 bins use that season’s shots only, shrunk toward the parent zone, recomputed every year. Free throws price at the season’s league rate, not the player’s own.
- This is shots only, not full EPA. There is no passing value in the quantification. xPTS is expected points per shot attempt.
- The collinearity problem persists, even in xPTS-RAPM. Teammates who always share the floor are hard to separate. Some players carry credit that belongs to their lineups. 2,000 weighted possessions is a floor, not a cure.
- Descriptive, not predictive. Chance creation does not out-predict actual results in basketball. xPTS and its RAPMs are context for how value is created, not a forecast.
Sources & Data
Joseph Sill / Regularized Adjusted Plus-Minus — MIT Sloan Sports Analytics Conference (2010)
Shot-quality prior art Cervone, D’Amour, Bornn & Goldsberry / EPV — MIT Sloan (2014)
Second Spectrum / qSQ & qSM — proprietary
Williams, Schliep, Fosdick & Elmore / EPAA — arXiv 2405.10453 (2024)
Soccer xG Understat / xG data and league tables — understat.com
The 75–80% figure is consistent with this paper’s own five-season computation (R² 0.78–0.89, table above)
External validation xrapm.com / pure no-prior three-year RAPM — xrapm.com
Data NBA play-by-play — NBA.com public data feeds
2015–16 defender-distance tracking — the publicly leaked SportVU sample, 295 of 1,230 games
All other computation is original.
Related Work
Modeling College Basketball Impact: Introducing C-ARC — the same impact framework, rebuilt for the collegiate game
Is this thing on? #NeverBooz