LUMA Paper №4
Estimating the Cost of NBA Shooting Volume: Points Above Cost (PAC)
October 1, 2026 · Working paper v1
v1 · October 1, 2026 · abstract; full paper in progress.
 Tap to read the full PDF
Read online · the abstract with additional figures and tables
Introduction
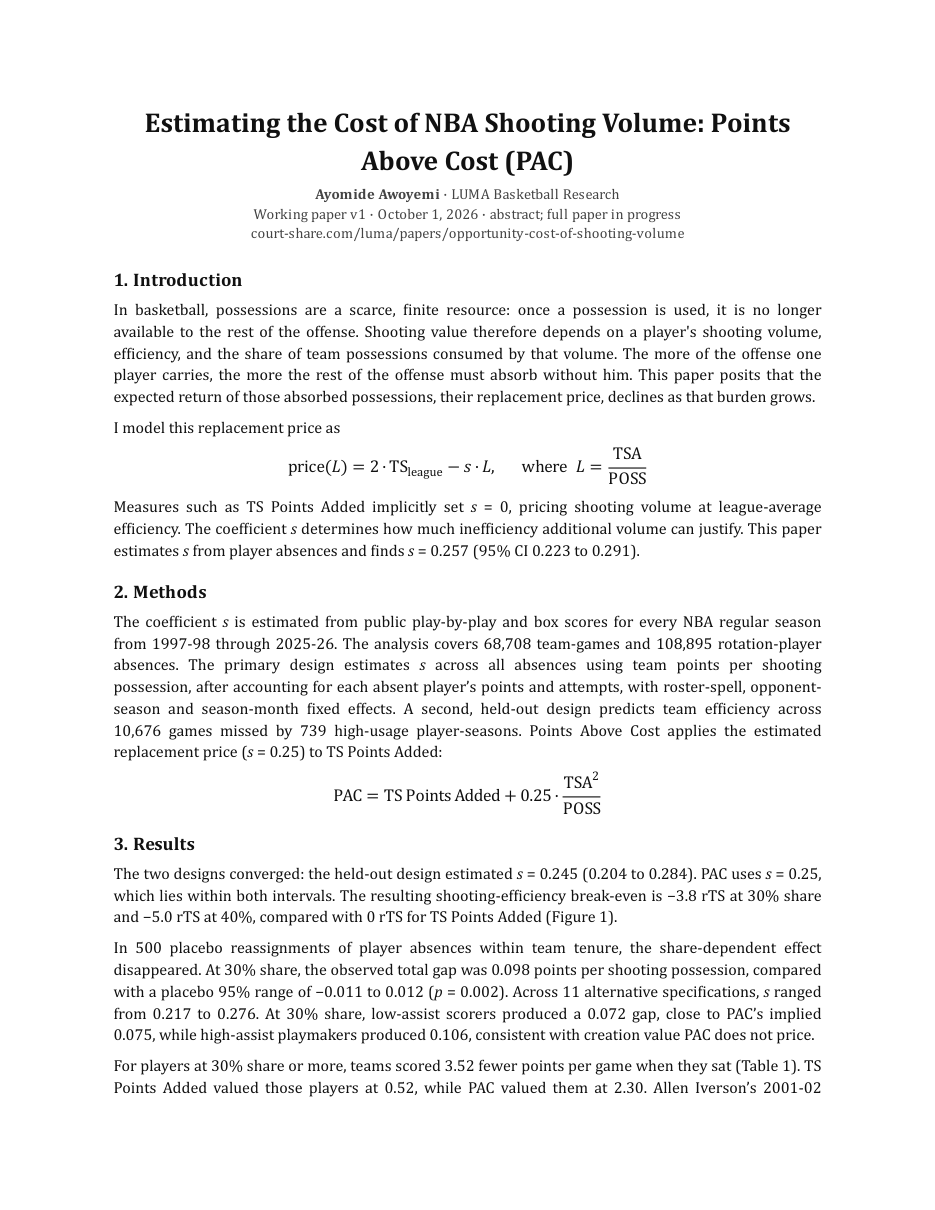
In basketball, possessions are a scarce, finite resource: once a possession is used, it is no longer available to the rest of the offense. Shooting value therefore depends on a player's shooting volume, efficiency, and the share of team possessions consumed by that volume. The more of the offense one player carries, the more the rest of the offense must absorb without him. This paper posits that the expected return of those absorbed possessions, their replacement price, declines as that burden grows.
I model this replacement price as
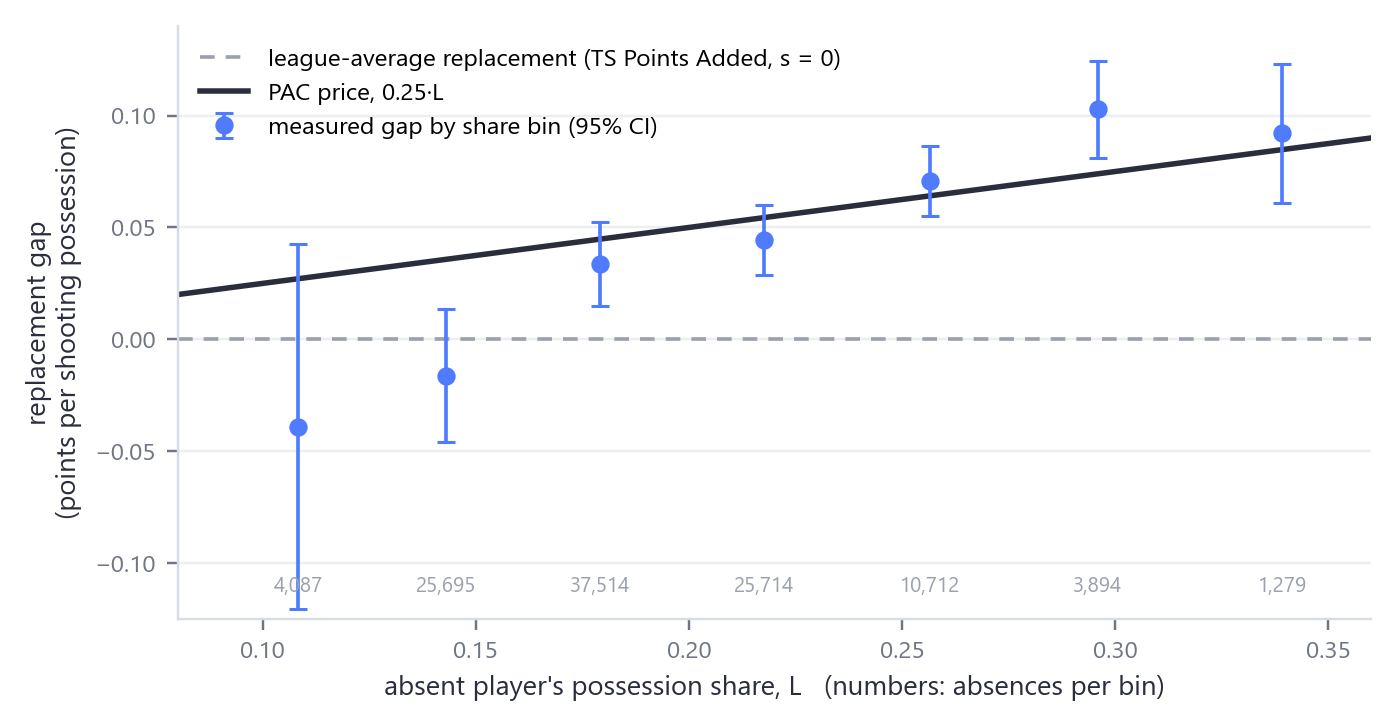
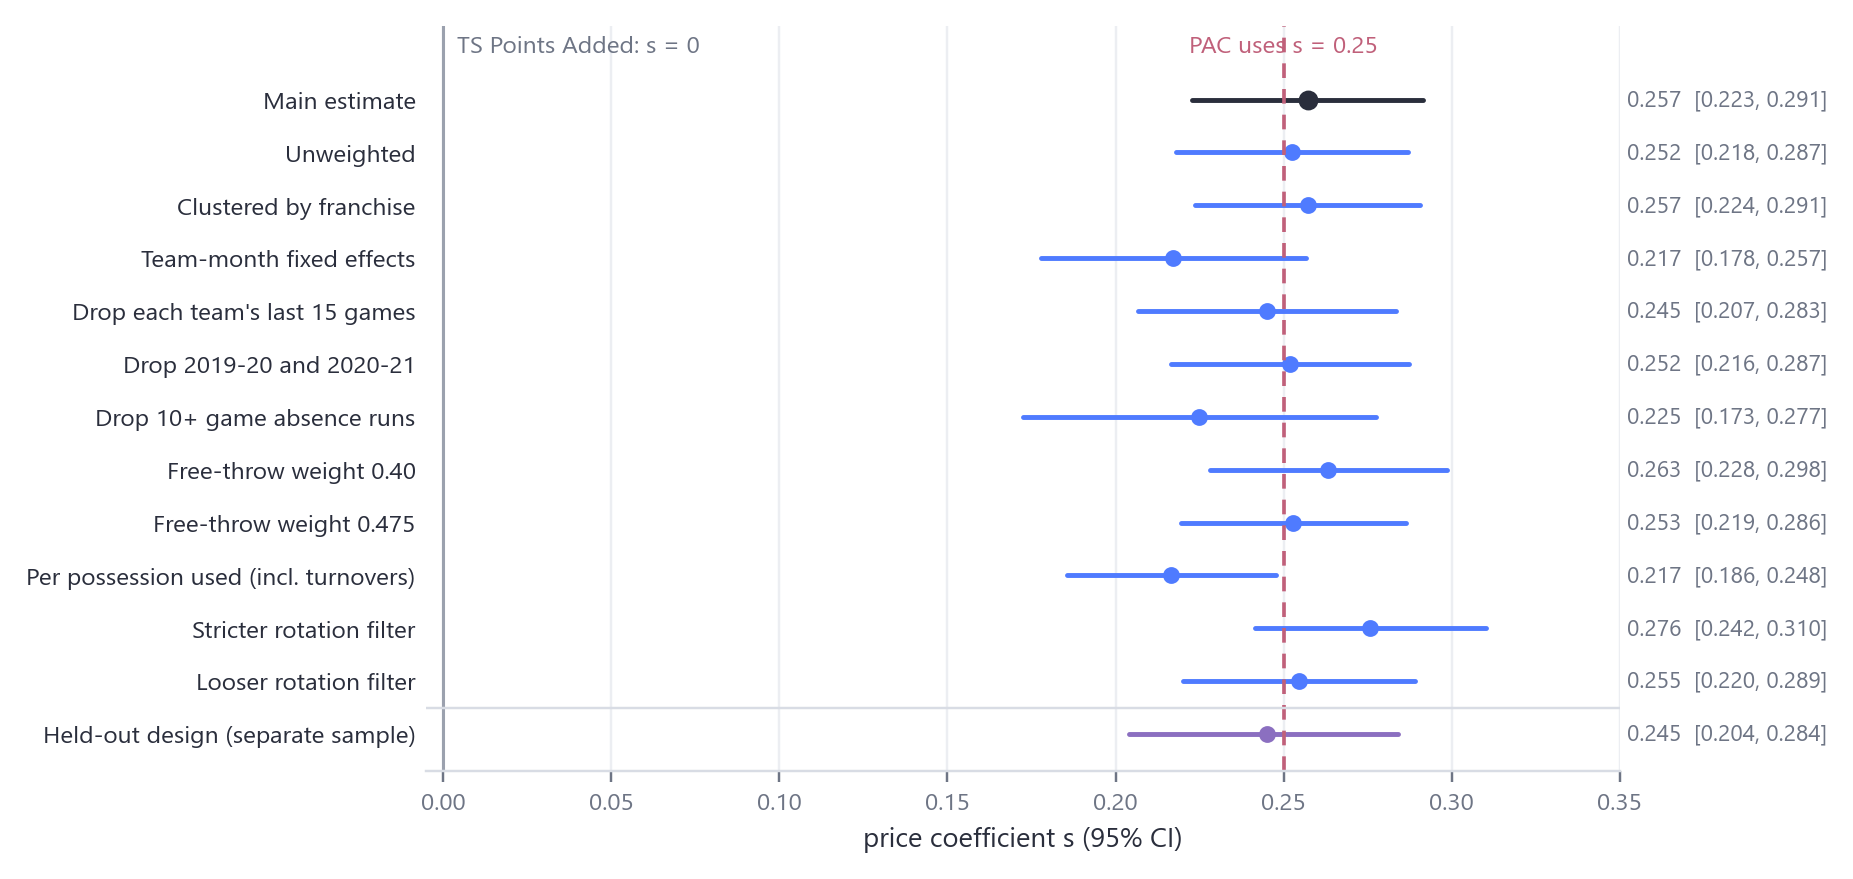
Measures such as TS Points Added implicitly set s = 0, pricing shooting volume at league-average efficiency. The coefficient s determines how much inefficiency additional volume can justify. This paper estimates s from player absences and finds s = 0.257 (95% CI 0.223 to 0.291).
Methods
The coefficient s is estimated from public play-by-play and box scores for every NBA regular season from 1997-98 through 2025-26. The analysis covers 68,708 team-games and 108,895 rotation-player absences. The primary design estimates s across all absences using team points per shooting possession, after accounting for each absent player’s points and attempts, with roster-spell, opponent-season and season-month fixed effects. A second, held-out design predicts team efficiency across 10,676 games missed by 739 high-usage player-seasons. Points Above Cost applies the estimated replacement price (s = 0.25) to TS Points Added:
Results
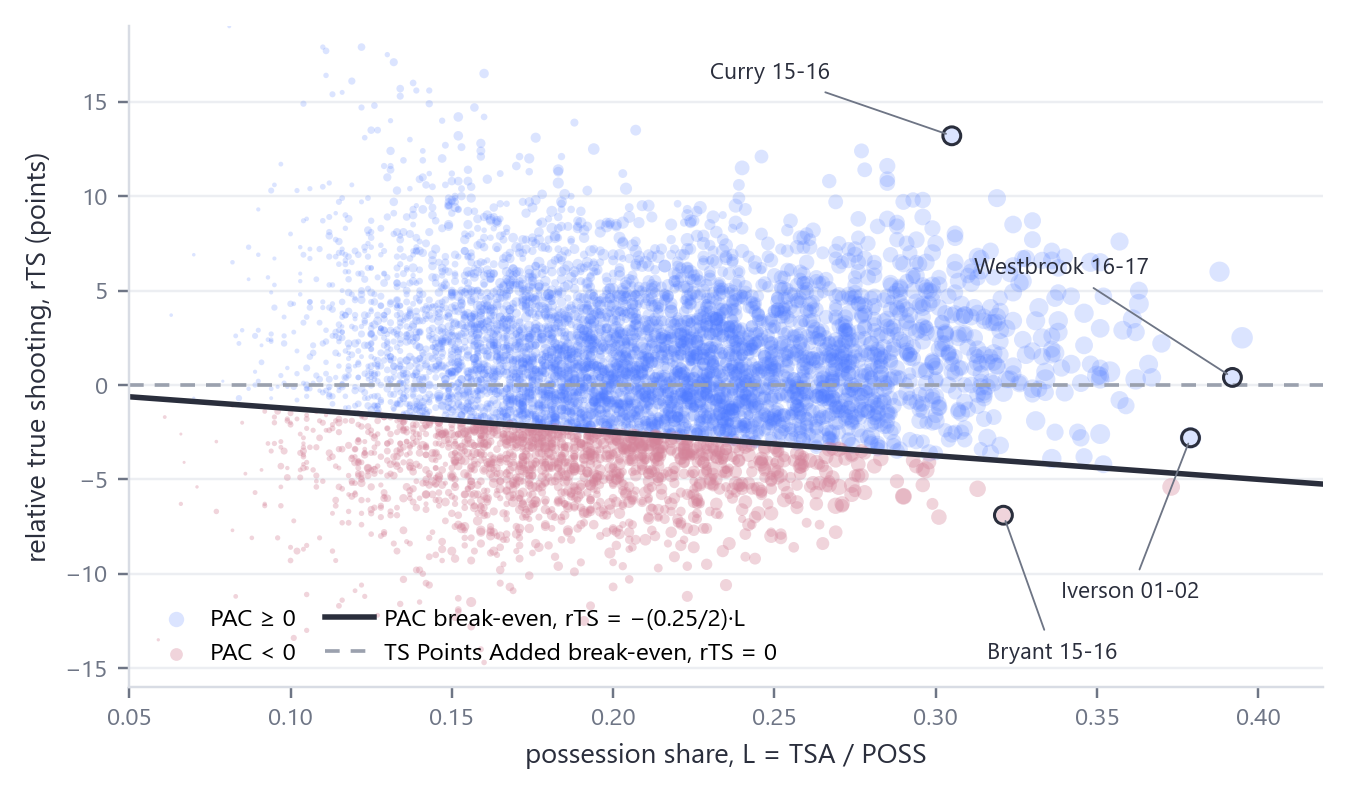
The two designs converged: the held-out design estimated s = 0.245 (0.204 to 0.284). PAC uses s = 0.25, which lies within both intervals. The resulting shooting-efficiency break-even is −3.8 rTS at 30% share and −5.0 rTS at 40%, compared with 0 rTS for TS Points Added (Figure 1).
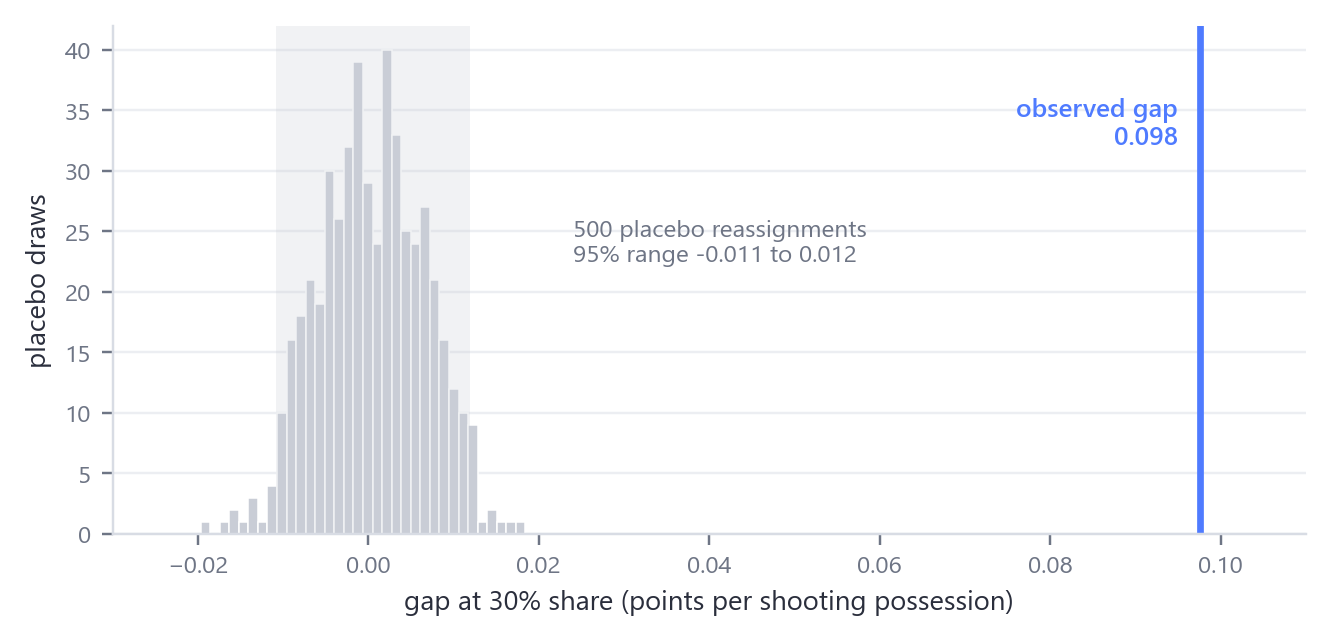
In 500 placebo reassignments of player absences within team tenure, the share-dependent effect disappeared. At 30% share, the observed total gap was 0.098 points per shooting possession, compared with a placebo 95% range of −0.011 to 0.012 (p = 0.002). Across 11 alternative specifications, s ranged from 0.217 to 0.276. At 30% share, low-assist scorers produced a 0.072 gap, close to PAC’s implied 0.075, while high-assist playmakers produced 0.106, consistent with creation value PAC does not price.
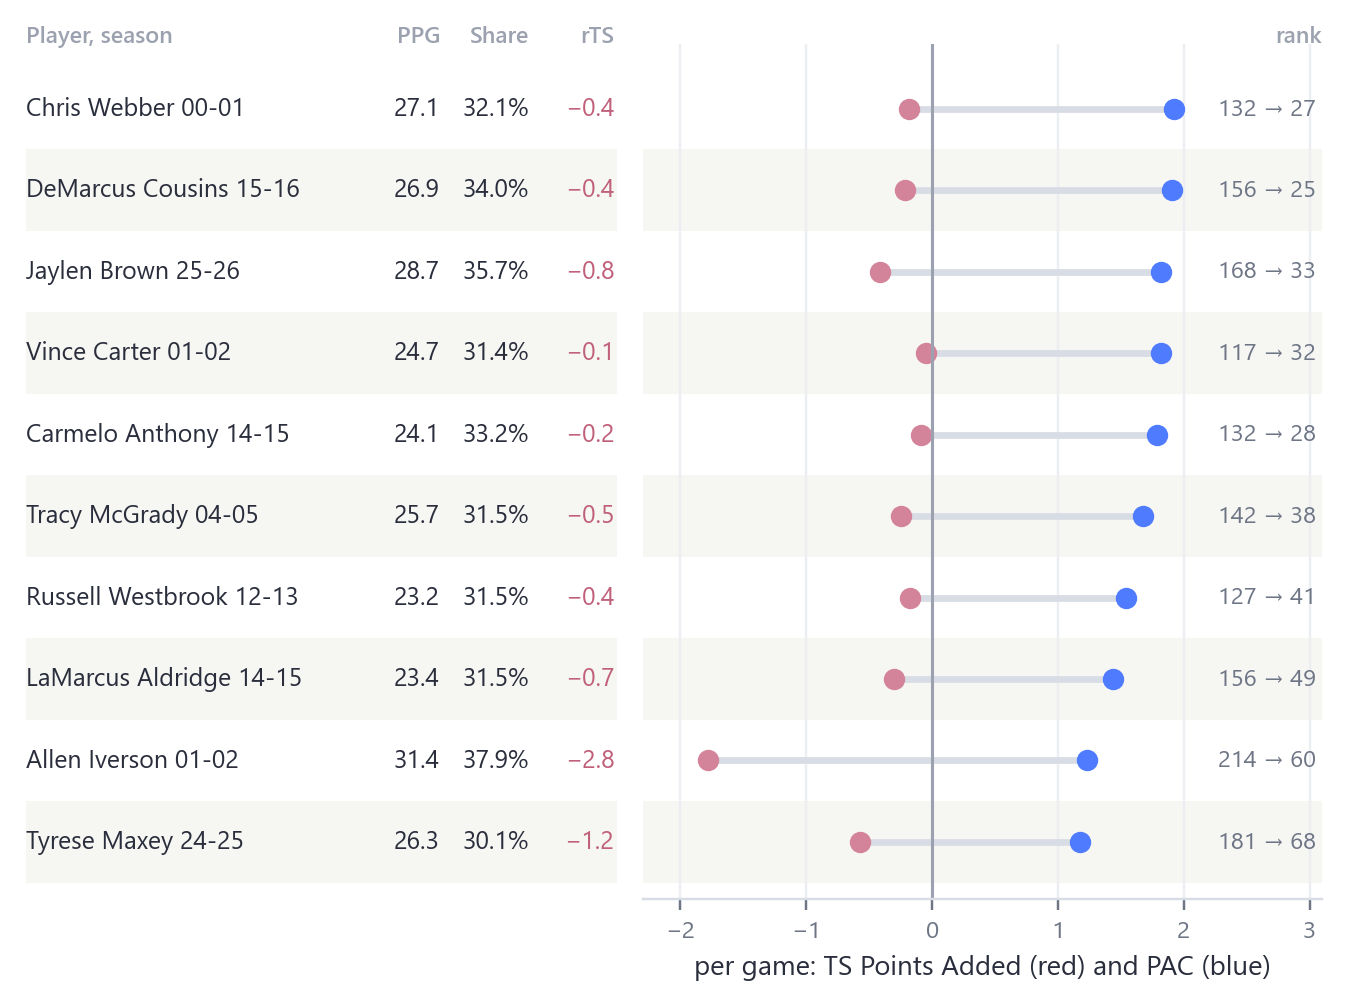
For players at 30% share or more, teams scored 3.52 fewer points per game when they sat (Table 1). TS Points Added valued those players at 0.52, while PAC valued them at 2.30. Allen Iverson’s 2001-02 scoring title illustrates the difference: TS Points Added values his scoring at −1.78 points per game, 214th of 216, while PAC credits him +1.23, 60th.
| Absent player's share | Absences | Actually lost | TS Added says | PAC (s = 0.25) says |
|---|---|---|---|---|
| Under 15% | 20,669 | −0.39 [−0.59, −0.19] | −0.08 | 0.10 |
| 15–20% | 46,627 | −0.12 [−0.28, 0.03] | −0.21 | 0.10 |
| 20–25% | 29,319 | 0.32 [0.13, 0.51] | −0.25 | 0.33 |
| 25–30% | 9,543 | 2.00 [1.68, 2.32] | 0.07 | 1.14 |
| 30% and up | 2,737 | 3.52 [2.92, 4.12] | 0.52 | 2.30 |
Actually lost: change in team points per game per absent player in each share bin, with roster-spell, opponent-season and season-month fixed effects and home, rest and opponent-absence controls (95% CI clustered by team-season). TS Points Added and PAC: the absent players' per-game values.
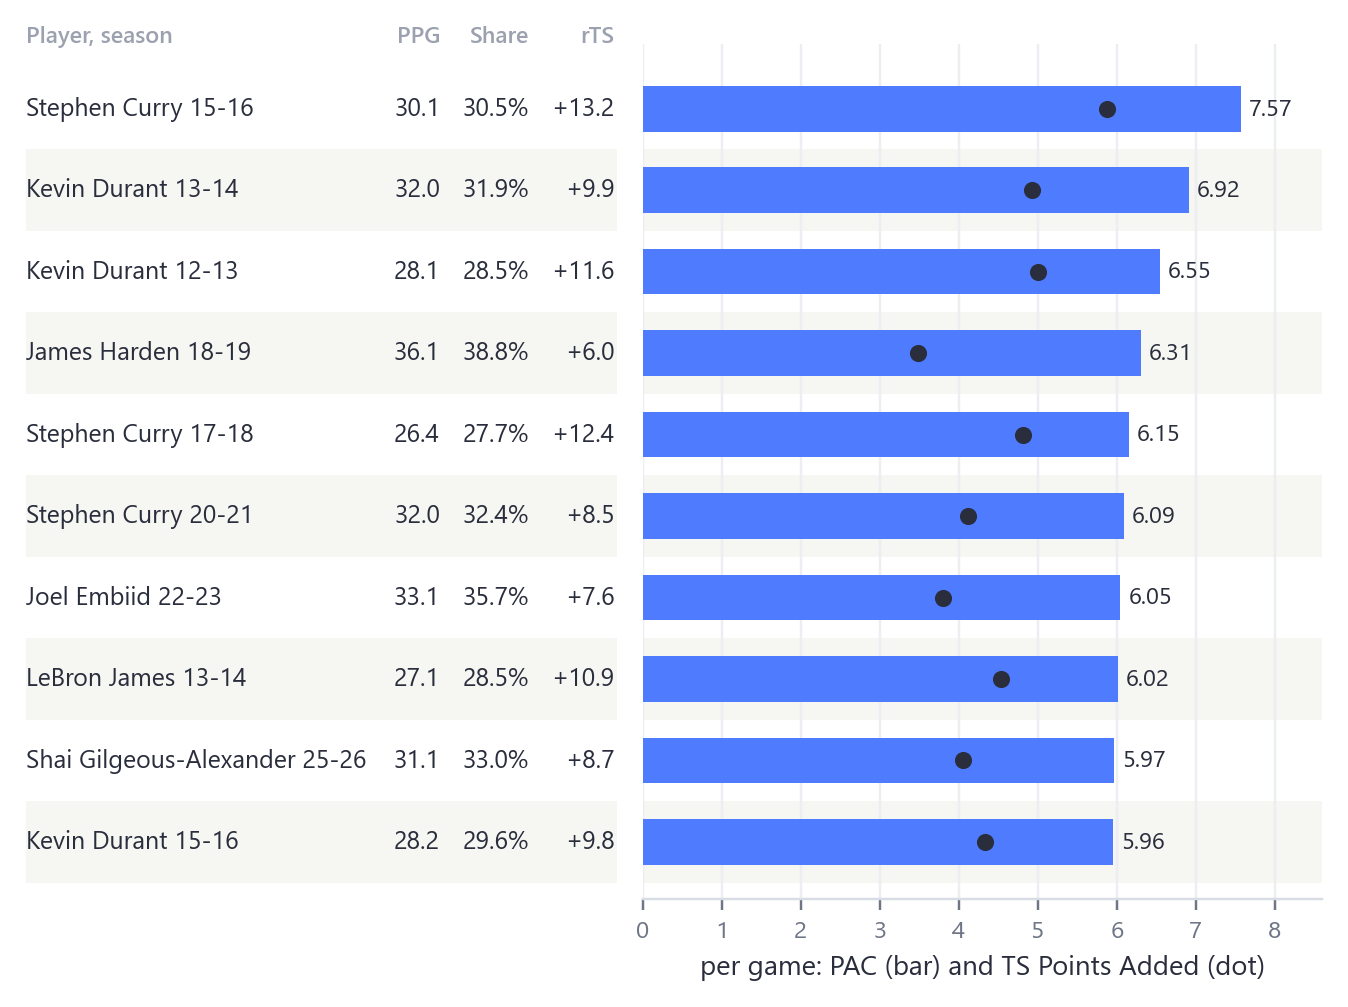
| TS Points Added | per game | Points Above Cost | per game | Relative true shooting | rTS |
|---|---|---|---|---|---|
| 1Shai Gilgeous-Alexander · 33.0% | 4.05 | 1Shai Gilgeous-Alexander · 33.0% | 5.97 | 1Jericho Sims · 8.1% | +19.0 |
| 2Nikola Jokić · 27.6% | 3.63 | 2Nikola Jokić · 27.6% | 5.06 | 2Ryan Kalkbrenner · 11.0% | +17.9 |
| 3Jalen Duren · 23.9% | 2.99 | 3Luka Dončić · 36.1% | 4.33 | 3Jaxson Hayes · 13.0% | +17.5 |
| 4Kevin Durant · 27.0% | 2.54 | 4Kawhi Leonard · 33.8% | 4.02 | 4Luke Kennard · 13.1% | +11.6 |
| 5Stephen Curry · 31.0% | 2.40 | 5Stephen Curry · 31.0% | 4.01 | 5Jalen Duren · 23.9% | +10.6 |
| 6Austin Reaves · 24.9% | 2.36 | 6Kevin Durant · 27.0% | 3.90 | 6Luke Kornet · 10.6% | +10.4 |
| 7Kawhi Leonard · 33.8% | 2.16 | 7Jalen Duren · 23.9% | 3.84 | 7Mark Williams · 17.2% | +9.7 |
| 8Zion Williamson · 25.5% | 1.99 | 8Anthony Edwards · 31.3% | 3.58 | 8Daniel Gafford · 14.9% | +9.5 |
| 9Jarrett Allen · 19.8% | 1.98 | 9Austin Reaves · 24.9% | 3.47 | 9Deandre Ayton · 16.3% | +9.4 |
| 10Luka Dončić · 36.1% | 1.88 | 10Victor Wembanyama · 32.0% | 3.42 | 10Neemias Queta · 15.0% | +9.1 |
Conclusion
Current measures of scoring value combine shooting volume and efficiency but hold a third quantity fixed at league average: the price of the possessions consumed. This paper provides an estimate of that price and finds that it falls as a player’s shooting load rises. PAC incorporates the estimated opportunity cost of possession usage, producing a load-dependent standard for evaluating scoring efficiency that comes much closer than a league-average baseline to the scoring teams lose when high-usage players sit.
References
- Goldman, M., & Rao, J. M. (2011). Allocative and dynamic efficiency in NBA decision making. MIT Sloan Sports Analytics Conference.
- Kubatko, J., Oliver, D., Pelton, K., & Rosenbaum, D. T. (2007). A starting point for analyzing basketball statistics. Journal of Quantitative Analysis in Sports, 3(3). doi.org/10.2202/1559-0410.1070
- Oliver, D. (2004). Basketball on Paper: Rules and Tools for Performance Analysis. Potomac Books.
- Sandholtz, N., & Bornn, L. (2020). Markov decision processes with dynamic transition probabilities: An analysis of shooting strategies in basketball. The Annals of Applied Statistics, 14(3), 1122–1145. arxiv.org/abs/1812.05170
- Sandholtz, N., Mortensen, J., & Bornn, L. (2020). Measuring spatial allocative efficiency in basketball. Journal of Quantitative Analysis in Sports, 16(4), 271–289. doi.org/10.1515/jqas-2019-0126
- Skinner, B. (2010). The price of anarchy in basketball. Journal of Quantitative Analysis in Sports, 6(1). doi.org/10.2202/1559-0410.1217
- Skinner, B. (2012). The problem of shot selection in basketball. PLoS ONE, 7(1), e30776. doi.org/10.1371/journal.pone.0030776
- Witus, E. (2008, March 6). Diminishing returns for scoring: Usage vs. efficiency. Count The Basket. www.countthebasket.com/blog/2008/03/06/diminishing-returns-for-scoring-usage-vs-efficiency/
Data and code: github.com/aayoawoyemi/pac · Public NBA play-by-play and box scores, 1997-98 to 2025-26. This version reproduces the abstract as of October 1, 2026; later versions will add the full paper. Read the PDF.