LUMAARCResearchAboutDevsChangelog
Decomps ↗NBA DECOMPS · COMING SOON · NBADECOMPS.COM_
LUMA Basketball ResearchLOKI one-pager · ARC one-pager · About · Changelog · Query terminalcourt-share.com/luma

LUMA Basketball Research · Research note · October 10, 2026

Possession by Possession FundamentalismOffensive Conversion and the Distribution of Player Value

Ayomide Awoyemi · LUMA Basketball Research

Possessions are a scarce, finite resource, and thus player value must be derived from the cumulative margin added within and across each possession played. This note measures the value of each of the eight additive components of Adjusted Regularized Contribution (ARC) across the distribution of NBA players from 2012–13 to 2025–26.

The note as a PDF · The thread on X

Ausar Thompson:

  • 98th% turnover generation
  • 94th% defensive shot selection
  • 89th% offensive rebounds

+3.82 ARC per 100 possessions

Curry: 31st pct in those decomps, but 100th in offensive conversion

ARC +5.79: 50% more impact per possession

Offensive Conversion is law.

Table 1. An elite converter against two broadly skilled players

ComponentStephen CurryAusar ThompsonDyson Daniels
ARC+5.79 98th+3.82 95th+4.94 97th
Offensive conversion+6.67 100th−1.02 37th+1.18 83rd
Offensive shot selection+0.57 89th+0.57 89th−0.14 40th
Offensive rebounds−0.56 19th+0.95 89th−0.28 29th
Ball security+0.34 79th−0.24 43rd+0.44 83rd
Defensive conversion−1.09 16th+1.36 89th+1.39 91st
Defensive shot selection−0.07 50th+0.60 94th+0.34 85th
Defensive rebounds−0.12 38th−0.07 42nd+0.06 57th
Forced turnovers+0.05 57th+1.67 98th+1.94 99th
Other seven components−0.88 31st+4.84 100th+3.76 96th

Two-year ARC ending 2025–26, points per 100 possessions of team margin; percentiles in small type (the seven-component sum is ranked among the 262 players with at least 3,000 possessions). “Other seven components” is ARC minus offensive conversion.
  • 2025–26
  • 2024–25
  • 2023–24
  • 2022–23
  • 2021–22
  • 2020–21
  • 2019–20
  • 2018–19
  • 2017–18
  • 2016–17
  • 2015–16
  • 2014–15
  • 2013–14
  • 2012–13
  • 2011–12
  • 2010–11
  • 2009–10
  • 2008–09
  • 2007–08
  • 2006–07
  • 2005–06
  • 2004–05
  • 2003–04
  • 2002–03
  • 2001–02
  • 2000–01
  • 1999–00
  • 1998–99
  • 1997–98
  • 1-year
  • 2-year
  • 3-year
  • 4-year
  • 5-year
  • Percentile
  • Rank
  • No player with enough possessions
  • No player with enough possessions
  • No player with enough possessions
  • No player with enough possessions

Loading…

Points per 100 possessions of team margin, relative to the league-average possession. Percentiles among the … players with at least 1,000 possessions in the window.
ARC
Shot valuePossession value
ConversionSelectionGenerationRetention
Offensive conversion
Defensive conversion
Offensive shot selection
Defensive shot selection
Offensive rebounds
Forced turnovers
Ball security
Defensive rebounds

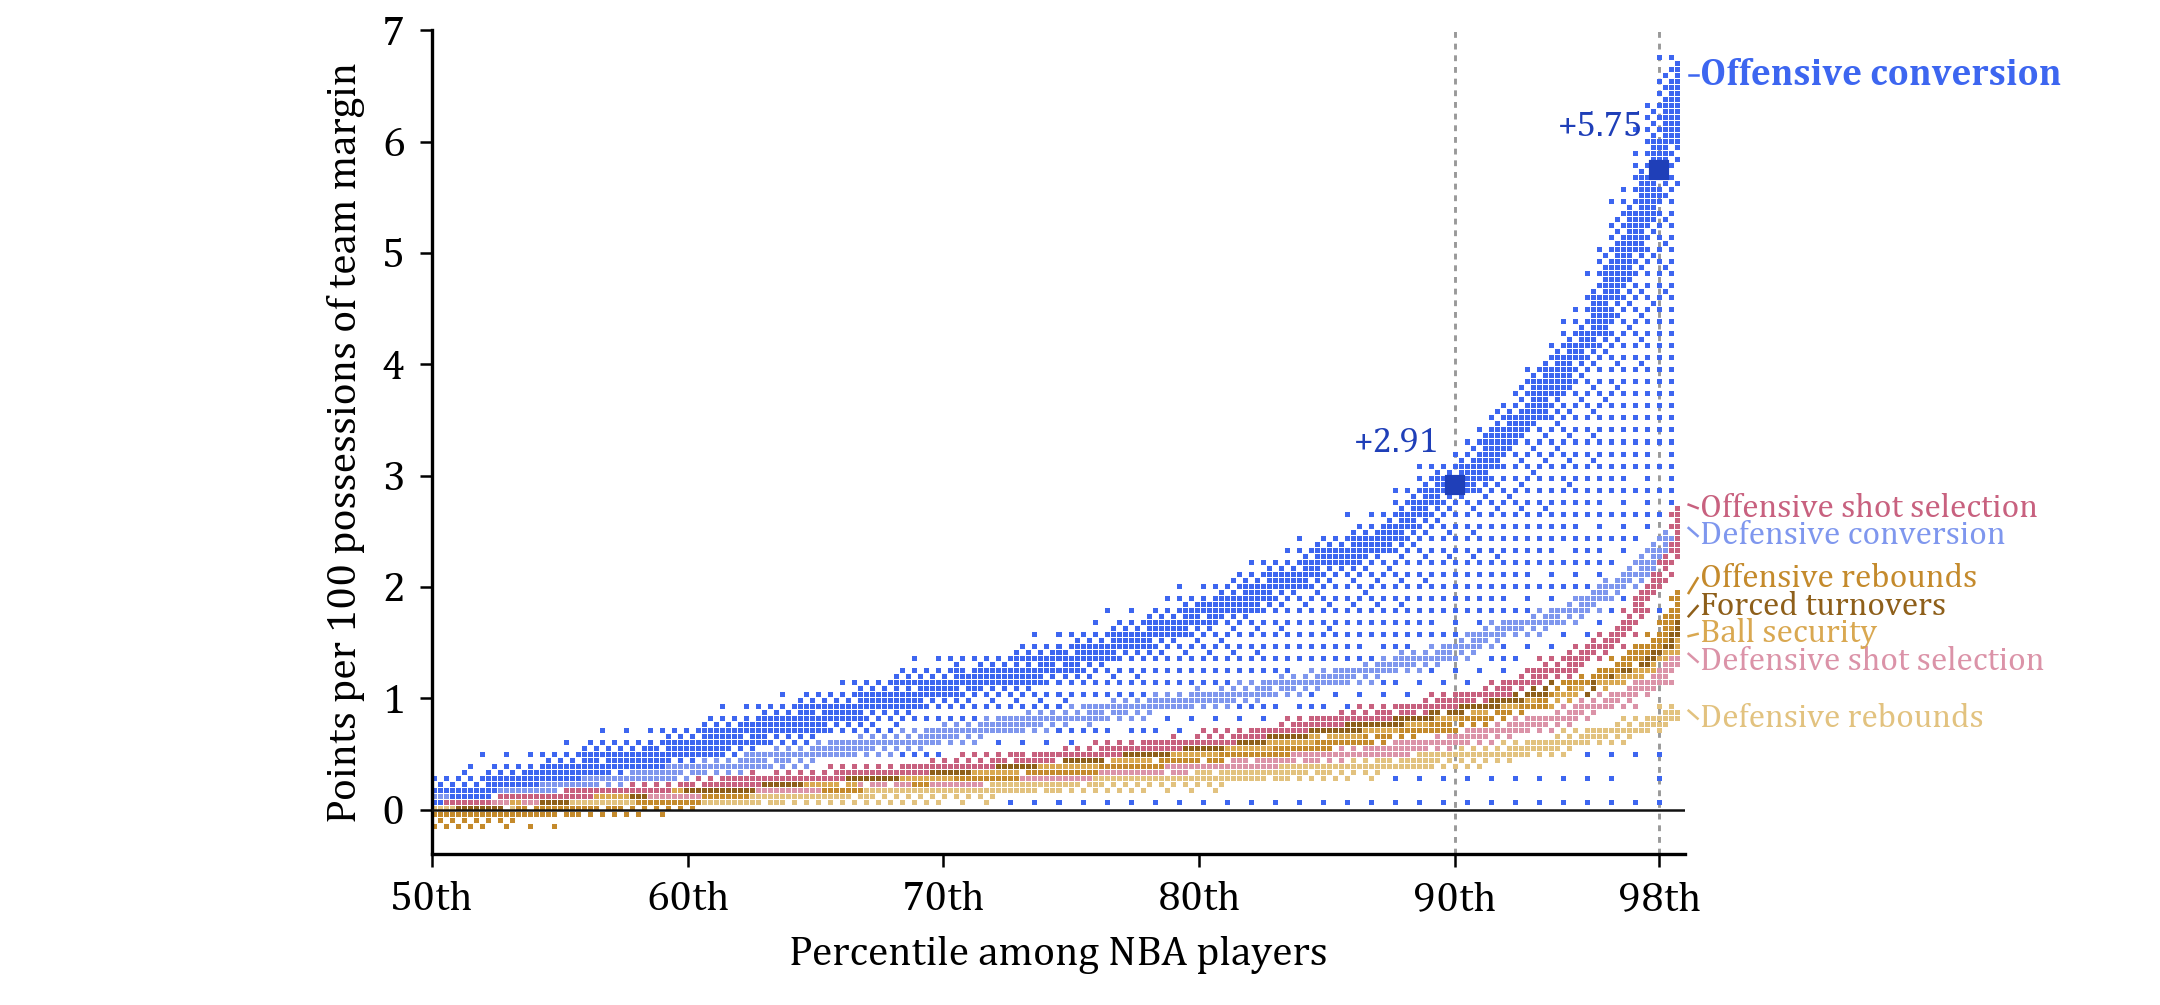
Table 2. Value of each ARC component by percentile (points per 100 possessions)

Component50th75th90th98th90th to 98thEquivalent offensive
conversion percentile
Offensive conversion+0.08+1.33+2.91+5.75+2.8398th
Defensive conversion+0.10+0.83+1.44+2.32+0.8886th
Offensive shot selection+0.03+0.47+0.95+2.11+1.1684th
Offensive rebounds−0.06+0.32+0.78+1.51+0.7377th
Forced turnovers−0.02+0.42+0.87+1.40+0.5376th
Ball security+0.02+0.39+0.82+1.33+0.5175th
Defensive shot selection+0.02+0.30+0.62+1.16+0.5471st
Defensive rebounds+0.00+0.23+0.47+0.78+0.3164th
Rim defense*+0.01+0.40+0.77+1.33+0.5675th
ARC (sum of components)+0.35+2.17+4.34+9.01+4.68

Two-year ARC windows, 2012-13 to 2025-26, players with at least 3,000 possessions (n = 2,108); the eight components sum to ARC. Final column: the offensive-conversion percentile equal in value to the component’s 98th percentile. *Opponent rim-attempt rate and rim finishing on the floor; part of defensive conversion and shot selection, shown for reference.

Figure 1. Value of each ARC decomposition by percentile

Figure 1

Points per 100 possessions of team margin. Two-year ARC windows ending 2012-13 to 2025-26, players with at least 3,000 possessions (n = 2,108).

Possession-by-possession fundamentalism

As I continue to work on my top 25 list before the season, I want to share some insight on the underlying methodology:

possession-by-possession fundamentalism.

Given the limited number of possessions, in an environment where every action within a possession can be quantified, whether tangibly (EPV) or abstractly (RAPM), what is the cumulative value a player generates for his team? (Again, possession by possession)

While this does include a lot of ancillary skills, such as turnover generation/suppression, rim protection, and shot-quality generation.

At the end of the day, offensive conversion is law.

One of the ways basketball can be described is as a beautiful game of chess, where two amorphous, dynamic systems are jockeying for the most efficient opportunities to put the ball in the net.

The very best offensive conversion influencers are hammers, able to maximize each constructed scarce opportunity, consistently over expectation.

And thus are substantially more impactful per possession than players with impact in other decomps or more varied impact flavor. Such as helping generate a surplus of possessions, or a positive margin of shot quality

Table 3. Percentile a median converter must reach in all seven other components to equal an elite converter

Reference playerARCRequired percentile,
all seven other components
98th in offensive conversion, 50th in all others+5.8489th
98th in offensive conversion, 40th in all others+4.8285th
98th in offensive conversion, 20th in all others+2.5171st
90th in offensive conversion, 50th in all others+3.0075th

A median converter ranks at the 50th percentile in offensive conversion. Each row reports the single percentile such a player must reach in all seven remaining components simultaneously for their ARC to equal that of the reference player. Same sample as Table 2; the 98th percentile of offensive conversion is +5.75, against a maximum of +2.32 for any other component at the 98th percentile.

Table 4. Association between prior-season roster component value and team wins, 2005-06 to 2025-26

ComponentCorrelation with winsWin difference, top
versus bottom quintile
Offensive conversion.55+19.0
Defensive conversion.36+12.9
Ball security.36+12.2
Defensive shot selection.38+12.0
Forced turnovers.32+11.3
Offensive shot selection.27+8.0
Defensive rebounds.03+2.6
Offensive rebounds−.17−6.6

630 team-seasons. Each roster’s component value is the possession-weighted sum of its players’ one-year ARC values from the preceding season, weighted by possessions in the season observed; players without a preceding season enter at zero. Quintiles rank team-seasons on that roster value. The negative estimate for offensive rebounds is consistent with a profile effect: rosters that recover more of their own misses also tend to miss more.

Why offensive conversion

The reason for this is essentially two fold:

1. It is the most tangible expression of value.

Every other component is a more latent and abstract expression of net rating.

Non oConversion components change either the net quality or volume of opportunities a team has to put the ball in the basket.

Offensive conversion is the one decomposition that translates directly into a team's net rating. regardless of the environment or context surrounding it.

2. The skill gap is huge. A 90th percentile converter versus a 10th percentile converter is separated by 4.9 points per 100 possessions.

With the next widest component: defensive conversion, separated by 2.7. Possession-based components (rebounds, turnovers, and turnover suppression) are 1 to 1.6 apart.

Even the distance between the top-level converters is massive: a 99th percentile converter and a 90th percentile converter are 3.7 points per 100 possessions apart. (Offensive shot selection next at 1.8)

Table 5. The gap at the top: 99th versus 90th percentile (points per 100 possessions)

Component99th vs 90th
Offensive conversion3.7
Offensive shot selection1.8
Offensive rebounds1.2
Defensive conversion1.1
Forced turnovers0.9
Defensive shot selection0.8
Ball security0.7
Defensive rebounds0.4

Two-year ARC windows ending 2012–13 to 2025–26, players with at least 3,000 possessions (n = 2,108). Each cell is the difference in value, in points of team margin per 100 possessions relative to the league-average possession, between a player at the higher and a player at the lower percentile of that component.

Table 6. The gap across the league: 99th and 90th versus 10th percentile (points per 100 possessions)

Component99th vs 10th90th vs 10th
Offensive conversion8.64.9
Defensive conversion3.72.6
Offensive shot selection3.51.7
Offensive rebounds2.71.5
Forced turnovers2.51.6
Ball security2.21.4
Defensive shot selection1.91.1
Defensive rebounds1.40.9

Two-year ARC windows ending 2012–13 to 2025–26, players with at least 3,000 possessions (n = 2,108). Each cell is the difference in value, in points of team margin per 100 possessions relative to the league-average possession, between a player at the higher and a player at the lower percentile of that component.

When appraising players

When appraising players, I am looking holistically.

You will see a number of Ancillary Warriors (AMEN) and Possessions Maxers (AUSAR) #TWINS @NileHoops

Though offensive engines (even the best singular ones) are the most rare and invaluable archetype in the league.

Everything else should be looked at as a plan of insulation to pad said engine's deficiencies, and/or as synergistic optimizations of the strengths of what should be the star in any team-building galaxy.

Table 7. The singular offensive conversion archetype, by level, 2025–26

LevelPlayerOffensive conversionOther seven componentsShot-load shareARC
Tier 1Stephen Curry+6.67 100th−0.88 31st30%+5.79 98th
Kevin Durant+6.30 99th−2.36 11th27%+3.94 95th
Tier 2Jamal Murray+4.46 98th−2.17 11th26%+2.29 87th
Devin Booker+4.21 98th−0.10 47th30%+4.11 95th
Jalen Brunson+3.49 97th−2.16 12th30%+1.33 79th
Anthony Edwards+3.47 97th−0.12 46th31%+3.35 92nd
Tier 3DeMar DeRozan+3.30 96th−3.34 4th25%−0.04 59th
Kon Knueppel+3.23 96th−0.36 42nd22%+2.87 90th
Karl-Anthony Towns+3.10 95th+0.31 54th26%+3.41 93rd
LaMelo Ball+3.10 95th−0.54 36th33%+2.56 88th
Tyler Herro+3.10 95th−2.98 6th27%+0.12 63rd

Two-year ARC ending 2025–26, players with at least 3,000 possessions (n = 262): offensive conversion at the 95th percentile or higher, the other seven components combined at or below the 60th percentile, and at least 22% of their team’s shot load while on the floor (2024–25 and 2025–26, possession-weighted). Tier 1: 99th–100th percentile in offensive conversion; Tier 2: 97th–98th; Tier 3: 95th–96th.

Table 8. Possession maxers and ancillary warriors, 2025–26

TypePlayerOther seven componentsPossession valueOffensive conversionARC
Possession maxerAusar Thompson+4.84 100th+2.31 97th−1.02 37th+3.82 95th
Possession maxerAlex Caruso+4.65 99th+2.13 97th−1.38 26th+3.27 92nd
Ancillary warriorAmen Thompson+4.07 98th+1.93 95th+0.73 77th+4.80 97th
Ancillary warriorLauri Markkanen+3.81 97th+1.55 91st+1.21 84th+5.02 97th
Ancillary warriorDyson Daniels+3.76 96th+2.16 97th+1.18 83rd+4.94 97th
Possession maxerMoussa Diabaté+3.60 95th+3.90 100th−0.01 63rd+3.59 93rd
Possession maxerClint Capela+3.58 95th+1.95 96th−2.23 11th+1.35 80th
Ancillary warriorMiles McBride+3.53 94th+2.41 98th−1.17 33rd+2.36 88th
Ancillary warriorTyrese Maxey+3.35 94th+1.74 94th+0.94 79th+4.29 96th
Ancillary warriorMarcus Smart+3.33 94th+1.23 85th−0.26 58th+3.07 91st
Possession maxerBam Adebayo+3.16 92nd+2.95 99th+1.31 85th+4.47 97th
Ancillary warriorScottie Barnes+3.07 92nd+1.45 90th−0.47 54th+2.60 88th

Same sample and units as Table 7: offensive conversion below the 90th percentile, the other seven components combined at the 90th percentile or higher, ordered by that sum. Players whose value is mostly defensive conversion and defensive shot selection (more than 60% of their positive value; e.g. Rudy Gobert, Jaren Jackson Jr.) are a singular defensive type and are excluded. Possession maxer: 95th percentile or higher in possession generation (offensive rebounds and forced turnovers) or 99th or higher in possession value; ancillary warrior: the rest.

What the ARC units mean

Btw, if you made it this far, please let me know your thoughts, or even DM me. If I'm not following you, I will follow u.

I'm realizing as I write this that I haven't really explained what the ARC units mean so here's a chart.

This is what I mean with possession by possession impact and what ARC tries to capture.

net rating impact per 100.

Table 9. What an ARC number means, in team points per 100 possessions

Shai Gilgeous-AlexanderVictor WembanyamaAverage playerKyle Kuzma
Offensive ARC+11.18+4.54+0.00−2.34
Defensive ARC+1.74+5.81+0.00−1.58
ARC (net)+12.91+10.34+0.00−3.92
Their team’s points per 100 possessions127.2120.5116.0113.7
Opponents’ points per 100 possessions114.3110.2116.0117.6
Net rating (margin per 100)+12.9+10.3+0.0−3.9
Margin per possession+0.129+0.103+0.000−0.039

Two-year ARC ending 2025–26. The league-average possession is worth about 1.16 points (116 per 100). With average teammates against average opponents, offensive ARC adds to the player’s team’s points per 100 and defensive ARC subtracts from the opponents’; ARC is the net of the two, the player’s effect on their team’s net rating per 100 possessions relative to the league-average possession.

More from the note

Read

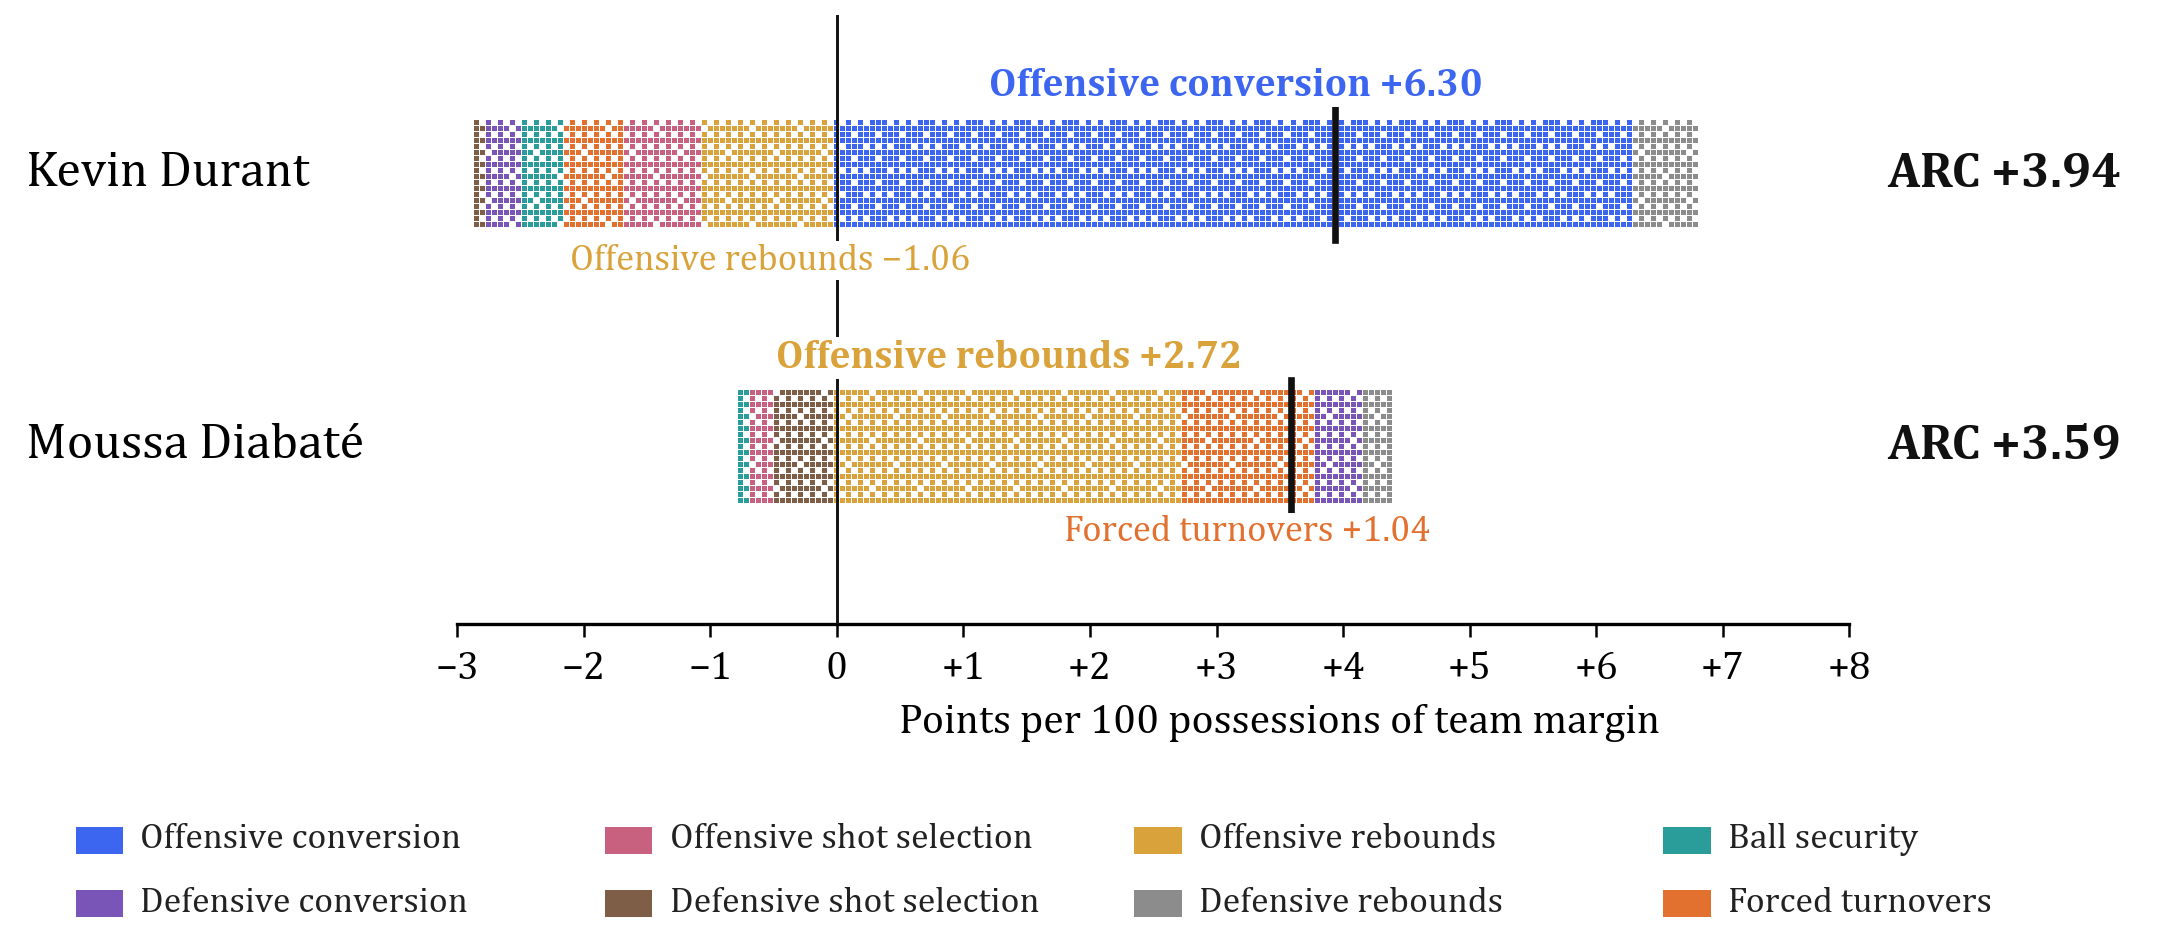
Table 10. A conversion-dependent scorer against the league’s leading possession gainer

ComponentKevin DurantMoussa Diabaté
ARC+3.94 95th+3.59 93rd
Offensive conversion+6.30 99th−0.01 63rd
Offensive shot selection−0.60 11th−0.20 35th
Offensive rebounds−1.06 4th+2.72 100th
Ball security−0.33 35th−0.09 53rd
Defensive conversion−0.27 42nd+0.40 65th
Defensive shot selection−0.10 46th−0.50 9th
Defensive rebounds+0.52 91st+0.24 72nd
Forced turnovers−0.51 23rd+1.04 93rd
Other seven components−2.36 11th+3.60 95th

Two-year ARC ending 2025–26, points per 100 possessions of team margin; percentiles in small type (the seven-component sum is ranked among the 262 players with at least 3,000 possessions). “Other seven components” is ARC minus offensive conversion.

Figure 2

Figure 2. ARC by component for Kevin Durant and Moussa Diabaté, two-year ARC ending 2025–26, in points per 100 possessions of team margin. Components right of zero add to ARC and components left of zero subtract from it; the black mark is ARC. Values for every component are reported in Table 10.

Table 11. The ten best offensive converters, 2025–26

PlayerOffensive conversionOther seven componentsARC
1. Shai Gilgeous-Alexander+8.86 100th+4.05 97th+12.91 100th
2. Nikola Jokić+7.99 100th+4.06 97th+12.05 100th
3. Stephen Curry+6.67 100th−0.88 31st+5.79 98th
4. Kawhi Leonard+6.39 99th+4.47 99th+10.86 100th
5. Kevin Durant+6.30 99th−2.36 11th+3.94 95th
6. Giannis Antetokounmpo+6.03 99th+4.17 98th+10.20 99th
7. Luka Dončić+5.89 99th+2.11 85th+8.00 99th
8. Jamal Murray+4.46 98th−2.17 11th+2.29 87th
9. Devin Booker+4.21 98th−0.10 47th+4.11 95th
10. Donovan Mitchell+4.16 98th+1.69 79th+5.85 98th

Two-year ARC ending 2025–26, players with at least 3,000 possessions (n = 262); points per 100 possessions of team margin. Percentiles in small type: league percentile for offensive conversion and ARC; for the seven-component sum, percentile among the same sample.

Table 12. The ten best players in the seven components other than offensive conversion, 2025–26

PlayerOffensive conversionOther seven componentsARC
1. Victor Wembanyama+3.62 97th+6.72 100th+10.34 99th
2. Ausar Thompson−1.02 37th+4.84 100th+3.82 95th
3. Alex Caruso−1.38 26th+4.65 99th+3.27 92nd
4. Kawhi Leonard+6.39 99th+4.47 99th+10.86 100th
5. Rudy Gobert−2.62 7th+4.17 98th+1.55 83rd
6. Giannis Antetokounmpo+6.03 99th+4.17 98th+10.20 99th
7. Amen Thompson+0.73 77th+4.07 98th+4.80 97th
8. Nikola Jokić+7.99 100th+4.06 97th+12.05 100th
9. Shai Gilgeous-Alexander+8.86 100th+4.05 97th+12.91 100th
10. Lauri Markkanen+1.21 84th+3.81 97th+5.02 97th

Same sample and units as Table 11. The seven components are offensive shot selection, offensive rebounds, ball security, defensive conversion, defensive shot selection, defensive rebounds and forced turnovers, summed.

Related

  • Introducing ARC v3: how ARC is built
  • The ARC board: every player, every component
  • Expected Box Value RAPM: counting the box score
  • Points Above Cost (PAC): the price of shooting volume
  • LOKI: predicted ARC
  • All research
  • The ratings as open data (GitHub)

LUMA Basketball Research / CourtShare · ARC v3.1