LUMAARCResearchAboutDevsChangelog
Decomps ↗NBA DECOMPS · COMING SOON · NBADECOMPS.COM_
LUMA Basketball ResearchLOKI one-pager · ARC one-pager · About · Changelog · Query terminalcourt-share.com/luma

LUMA Basketball Research · Article · October 9, 2026

Introducing ARC v3An Expected Box Value Prior RAPM (EBV RAPM)

Ayomide Awoyemi · LUMA Basketball Research

The original thread on X · The ARC v3 one-pager

Why not just count them up?

Contemporary all-in-one impact metrics often regress box score actions onto RAPM to find their weights.

A fitted model can give a steal about 3 times the value of a point scored leaving us with an opaque number that can't be decomposed into how or the degree they affect the game

why not just count em up?

Introducing ARC v3, an Expected Box Value Prior RAPM (EBV RAPM), that aims to quantify impact using possession by possession accounting

What is an EBV RAPM?

The next best thing to Expected Possession Value

Expected possession value (EPV) is the continuous measurement of the expected point value of a possession, updated with every pass, shot angle and defender distance even down to the prior conversion history of a shooter.

Though it requires granular optical tracking data (Second Spectrum), it is a great accounting of actualized production (a tangible accounting of a player's produced value) with less raw abstraction than on/off data, where one need thousands of samples to attempt to properly allocate credit.
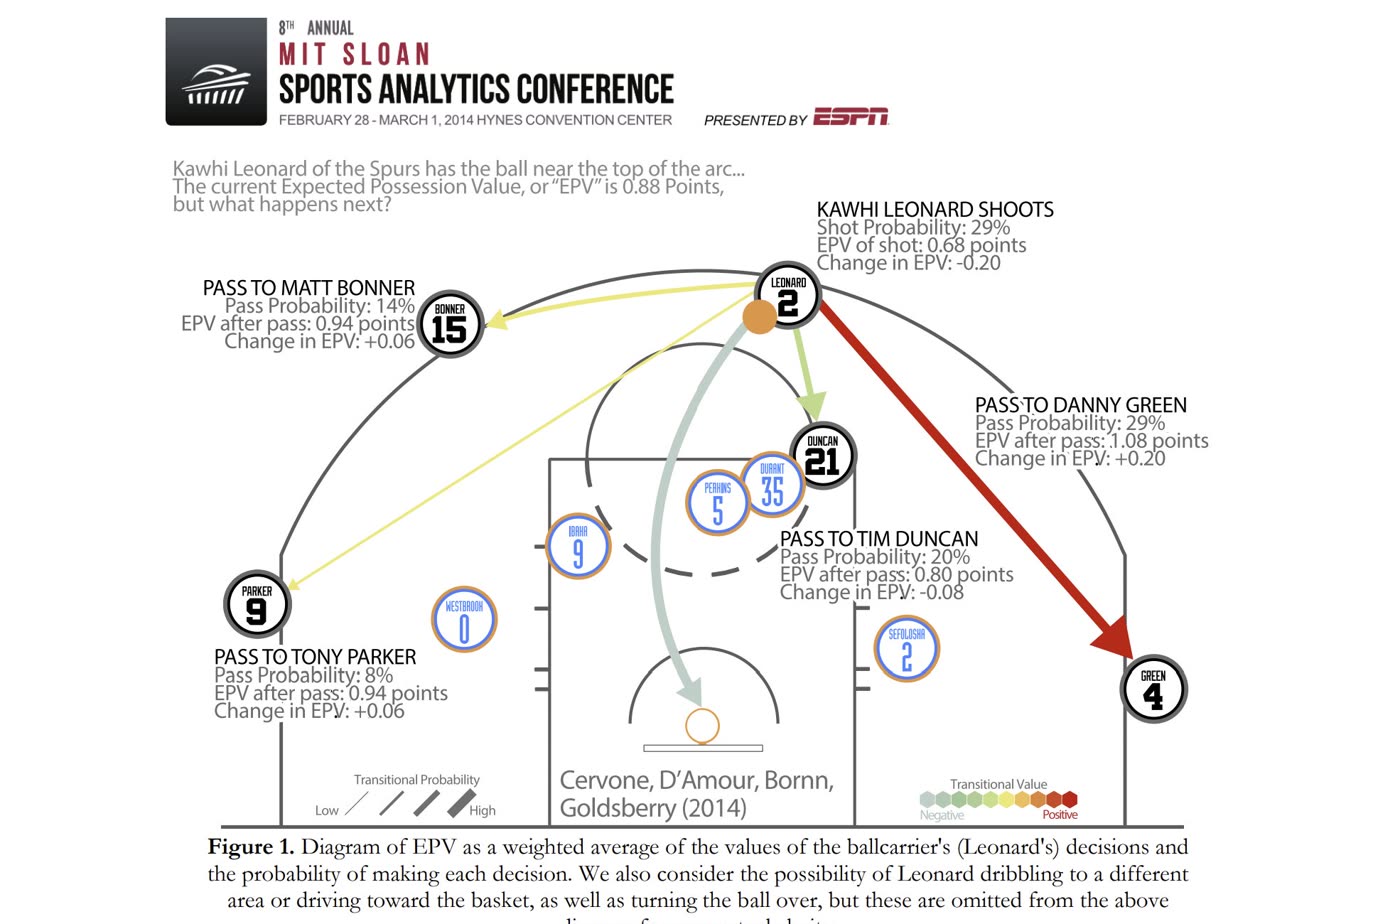
Diagram of expected possession value: Kawhi Leonard's options at the top of the arc, each with its probability and change in EPV
Expected possession value, from Cervone, D'Amour, Bornn and Goldsberry (2014), MIT Sloan Sports Analytics Conference.

Expected Box Value

Expected Box Value is the next best derivative

A calculation of how each box score action (OReb, STL, screen AST, foul, etc etc.) affects the average possession (2026: 1.16 PPP)

For example, after counting nearly 250,000 possessions from the 2025–26 season, a steal was found to be worth roughly 1.3 points.

It erases the opponent's possession, and the possession that follows averages 1.32 points, as it often creates an advantageous position for the "stealing" team.

average possession · 1.16Missed three−0.86shooterOffensive rebound+0.86rebounderMade two, assisted+0.84shooter and passer1.160.301.162.002 points
Simplified illustration · 2025–26 league averages

EBV as the prior

Whereas the prior renditions of ARC separately calculated and summed Box Values together via z-scored weights outside the solve, v3 uses EBV as a starting estimate of a player's skill, a prior, within the solve.

Season-end top 102025–26
  1. 1Shai Gilgeous-AlexanderOKC+12.9
  2. 2Nikola JokićDEN+11.5
  3. 3Kawhi LeonardLAC+11.0
  4. 4Victor WembanyamaSAS+10.7
  5. 5Giannis AntetokounmpoMIL+10.2
  6. 6Luka DončićLAL+7.6
  7. 7Jimmy Butler IIIGSW+6.6
  8. 8Stephen CurryGSW+5.8
  9. 9Chet HolmgrenOKC+5.7
  10. 10Donovan MitchellCLE+5.7
1998–992025–26

2-year ARC · played 55%+ of games over the two seasons

Related

  • Introducing ARC v3: the one-pager
  • The ARC board: every player, every component
  • Possession by Possession Fundamentalism
  • LOKI: predicted ARC
  • All research
  • The ratings as open data (GitHub)

LUMA Basketball Research · ARC v3.1

A
R
C

And The more possession sample the model has on a player, the more it leans on the lineup portion and deviates from the starting EBV

This Bayesian blend treats the actualized production of a player as foundational context, then adds the abstraction of a pure RAPM to fill in the pieces of context the box-score valuation may have missed

Lineups add the most beyond his box value

#PlayerEBVLineupsARC
1Marcus Smart LAL−1.45+4.52+3.07
2Jalen Smith CHI−0.58+3.91+3.33
3Moussa Diabaté CHA−0.29+3.89+3.59
4Zach Edey MEM−0.83+3.75+2.92
5Derrick White BOS+1.37+3.52+4.89
6Nique Clifford SAC−3.19+3.51+0.32

Lineups take the most away

#PlayerEBVLineupsARC
1Isaiah Collier UTA−0.48−4.39−4.87
2Jarace Walker IND−1.51−3.74−5.25
3James Harden CLE+4.82−3.62+1.19
4Drake Powell BKN−3.46−3.53−6.98
5Rayan Rupert MEM−3.37−3.52−6.89
6Reed Sheppard HOU+1.17−3.40−2.23
Two-year ARC ending 2025–26, players with 2,000+ possessions. EBV is his individual skill: the Expected Box Value of his own box score, the prior. Lineups is what on-court results add to it or take away. EBV + lineups = ARC.

Counting versus fitting

Contemporary all-in-one impact metrics often regress box-score actions to RAPM to find the "weight" of how each box-score action influences RAPM

For example instead of EBV's 1.3 for a steal a fitted model can give steals a value 3x that of a point scored

RAPM penaltyStealPoint scoredSteal ÷ point
Light+1.27+0.373.4×
Medium+0.89+0.303.0×
Heavy+0.48+0.202.4×

EBV correlates naturally without any "contamination" with RAPM with an r = .56

Allowing you to have two separate valuations of a player's production

Top 10 by individual skill (EBV)

#PlayerEBVARC
1Shai Gilgeous-Alexander OKC+12.53+12.91
2Nikola Jokić DEN+11.96+12.05
3Giannis Antetokounmpo MIL+9.76+10.20
4Kawhi Leonard LAC+9.29+10.86
5Luka Dončić LAL+8.77+8.00
6Victor Wembanyama SAS+7.63+10.34
7Stephen Curry GSW+6.57+5.79
8Jimmy Butler III GSW+5.84+6.73
9Donovan Mitchell CLE+5.77+5.85
10Anthony Edwards MIN+5.43+3.35

Top 10 by lineups

#PlayerLineupsARC
1Marcus Smart LAL+4.52+3.07
2Jalen Smith CHI+3.91+3.33
3Moussa Diabaté CHA+3.89+3.59
4Zach Edey MEM+3.75+2.92
5Derrick White BOS+3.52+4.89
6Nique Clifford SAC+3.51+0.32
7Hugo González BOS+3.50+0.35
8Herbert Jones NOP+3.49+1.08
9Neemias Queta BOS+3.40+3.75
10Davion Mitchell MIA+3.34+2.08
Two-year ARC ending 2025–26, players with 2,000+ possessions. The same rating, valued two ways: by what his own box score is worth (EBV, his individual skill), and by what the lineups he played in add beyond it.

Describing versus holding

The Value of EBV and ARC is best demonstrated by the descriptive validation test of pure RAPM and BPM (Box Plus Minus)

Pure RAPM has been shown to be a better aggregate descriptor of value created, but a poor and unstable allocator of individual credit.

Summed across a roster, team RAPM describes a team's actual net rating within a season almost perfectly (r² .96, against .77 for ARC): a team with a higher total RAPM performs better more often.

Though at the individual level, multicollinearity and small samples, and team effects means it can't as easily be trusted as a player's true talent or true value unless you believe about 3/4s of a player's value changes every year.

Box plus-minus sits on the opposing spectrum, the most stable estimate of a player year to year talent but a weak description of what actually happened on the court:

Pure RAPMARC v3LEBRONBPM
Describes: player on/off (r²).77.75.46.35
Describes: lineup net within team (r²).26.23.12.08
Holds: next non-overlapping 2-year window (r).43.62.76.76
Holds: players who changed teams (r).36.52.71.71

ARC V3 is the best of both worlds

nearly matching pure rapm in team net description and closer to BPM's stability.

Decomps, decomps, decomps

This is the part I'm most excited about.

When you regress box score actions, you often are left with an opaque number and lose the ability to decompose your impact metric.

Which is why you often see the deepest decomposition being offensive or defensive, with nothing about how they impact the game, the degree or the context in which they do it.

With ARC v3, you have a much deeper decomposition preserved.

Not only do you have offense and defense, but you also have individual skill versus lineup context.

You can have different decomps of impact. My favorite being Shot Value Vs Possession Value Or the 6 factor decomposition popularized by @databallr

Loading…

Each node is the exact sum of its children (to rounding). Points per 100 possessions against the average possession. Switch the split: it is the same number, read another way.

yes im using Franz due to u guys @patelsahil2002 and @Baldg0d

How to read ARC

An ARC of 0 means a neutral effect on his team's net points per 100 possessions, relative to the average possession. As more possessions are played by better players ARC is functionally in units of points value created above a rotation player.

-6-4-20+2+4+6+8+10+120 = average possessionTop 10#1–10+8.0Stars#11–30+4.1Starters#31–150+1.3Rotation#151–300−0.6Bench#301–450−2.2Deep bench#451–582−3.5
Every player on the 2025–26 2-year board, grouped by rank. Hover a dot to see who it is; the bar and the number at the right are the tier’s median.

Read any player

Type up to four players to see what their ARC means for their team's points and their opponents' points per 100 possessions.

League-average possession
Offensive ARC…
Defensive ARC…
ARC (net)…
His team’s points per 100 possessions…
Opponents’ points per 100 possessions…
Net rating (margin per 100)…
Margin per possession…
Two-year ARC ending 2025–26. The league-average possession is worth about 1.16 points (116 per 100). With average teammates against average opponents, offensive ARC adds to his team’s points per 100 and defensive ARC subtracts from the opponents’; ARC is the net of the two, his effect on his team’s net rating per 100 possessions relative to the league-average possession.

The full ARC board →