LUMAARCResearchAboutDevsChangelog
Decomps ↗NBA DECOMPS · COMING SOON · NBADECOMPS.COM_
LUMA Basketball ResearchLOKI one-pager · ARC one-pager · About · Changeloglumahoops.org

LUMA Basketball Research · Research note · November 3, 2026

Analyzing SGA and the Value of Soaking Up UsagePoints Above Cost

Ayomide Awoyemi

PDF · The thread on X · PAC

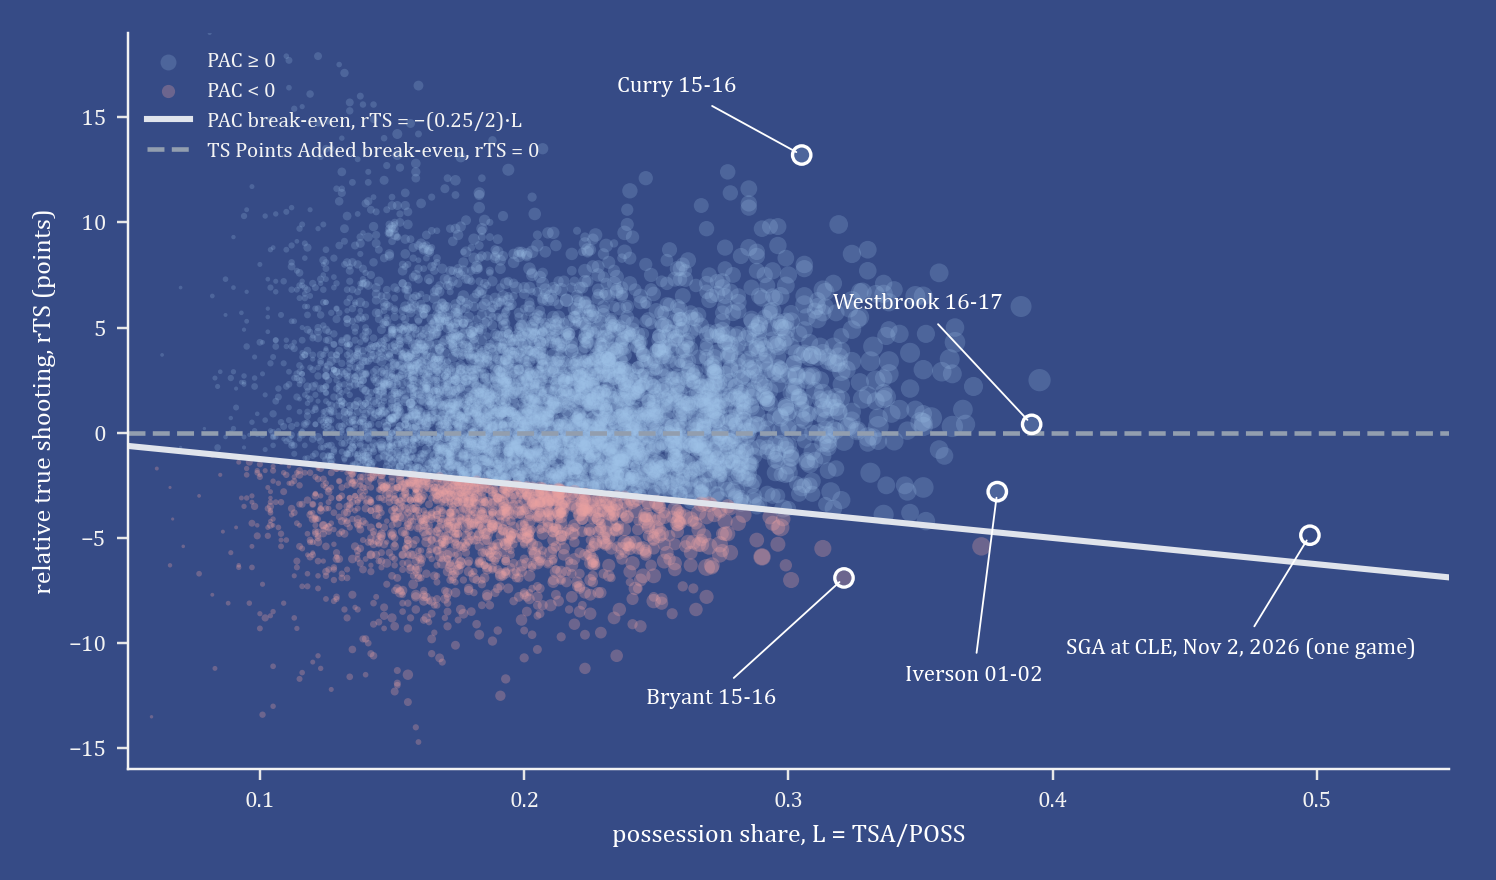
On a night where injuries forced OKC to play rookies for 44 minutes, and with only Ajay as another shot creator, SGA scored 43 points on 35 shots (−4.9 rTS). And was a great example of the value of soaking up usage, and why PAC exists. (Efficiency cannot be looked at in a vacuum. It has to be viewed through the lens of opportunity cost.)

Table 1. OKC's half-court offense, 2024-25 and 2025-26 regular seasons

2024-252025-26
League half-court points per 100110.2111.2
OKC half-court points per 100 (rank of 30)115.6 (3rd)114.0 (8th)
SGA on the floor119.5 (4,619 poss.)118.4 (4,184 poss.)
SGA off the floor, games he played (rank equivalent)105.2 (25th; 1,864 poss.)106.5 (27th; 1,885 poss.)
Games he missed117.5 (6 games)110.7 (14 games)
SGA's share of OKC's unassisted half-court field goals45.9%42.7%
Next playerJalen Williams, 20.2%Ajay Mitchell, 12.1%
Teammates' attempts that are self-created, SGA on / off34.5% / 48.7%32.8% / 48.2%
Teammates' eFG, self-created / all other shots45.9% / 60.4%47.5% / 57.8%
Teammates' true shooting, SGA on / off58.0% / 55.7%58.1% / 56.0%

Half court: possessions with no shot tagged fastbreak. Self-created: attempts tagged pull-up, step-back, fadeaway, turnaround or driving. Teammates: every OKC player except SGA. Rank equivalent: where that figure would place among the 30 teams that season.
Data: public NBA play-by-play, 2024-25 and 2025-26 regular seasons. LUMA Basketball Research · lumahoops.org

SGA soaked up 37% of OKC's shooting possessions, with 34 of his 35 shots coming in the half court.
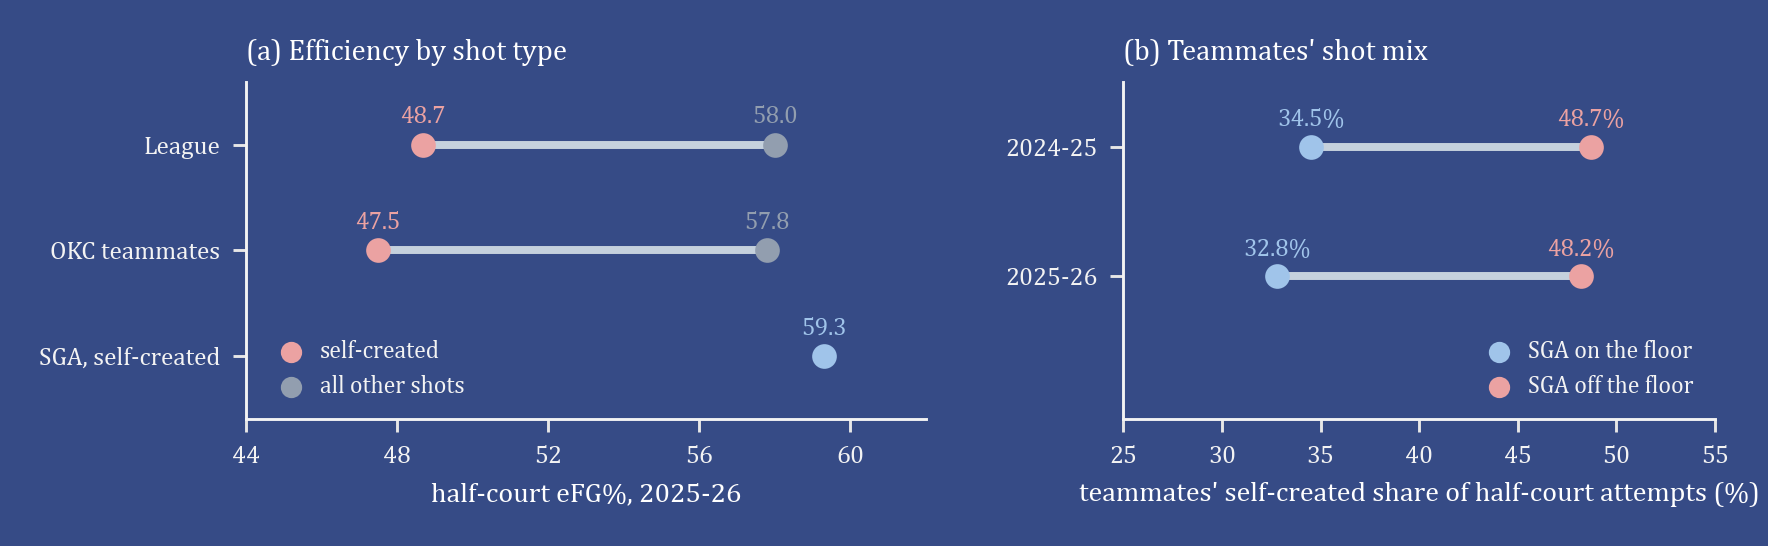
Last season, even when healthier, OKC was notoriously poor in half-court creation. With SGA off, OKC scored 105.8 points per 100 HC possessions, 5 pts under league avg. With him on, it was 118.3 (13 pts above). Without him, his teammates took 95 shots per 100 possessions instead of 65, and the share of their makes that were assisted fell from 75% to 67%.

And in just 200 possessions w/o this season, they are −19 in the half court than vs W/him.

The two things that kill efficiency when scaling up: increase in shot load and shot difficulty.

Left: half-court eFG on self-created and other shots for the league, OKC teammates and Gilgeous-Alexander. Right: share of OKC teammates attempts that are self-created with him on and off the floor

Figure 1. (a) Half-court eFG on self-created shots and on all other shots, 2025-26. (b) Share of OKC teammates' half-court attempts that are self-created, SGA on and off the floor. Self-created: attempts tagged pull-up, step-back, fadeaway, turnaround or driving.

Table 2. Half-court offensive RAPM, 2024-25 and 2025-26 pooled (players with 3,000+ half-court offensive possessions)

RankPlayerHalf-court O-RAPMHalf-court poss.All-possession O-RAPM (rank)
1Stephen Curry+6.196,550+5.85 (4th)
2Shai Gilgeous-Alexander+6.138,803+5.99 (2nd)
3Nikola Jokić+6.128,533+6.54 (1st)
4Jamal Murray+5.908,966+5.41 (5th)
5Giannis Antetokounmpo+5.276,120+5.88 (3rd)
6Kawhi Leonard+4.485,700+4.89 (6th)
7LaMelo Ball+4.416,363+4.50 (7th)
8Luka Dončić+4.187,342+4.44 (8th)
9Karl-Anthony Towns+3.758,580+3.77 (9th)
10Austin Reaves+3.617,772+3.12 (18th)

Points per 100 offensive possessions above average, holding the other nine players fixed (309 qualified players).
Data: public NBA play-by-play, 2024-25 and 2025-26 regular seasons. LUMA Basketball Research · lumahoops.org

To put into perspective just how much conversion is a skill: last night SGA made contested shots at the same rate that his teammates made open ones, 45% (9-20) vs 46% (18-39). League-wide last season, catch-and-shoot eFG was 55.0%. Pull-up eFG, at 45.9%.

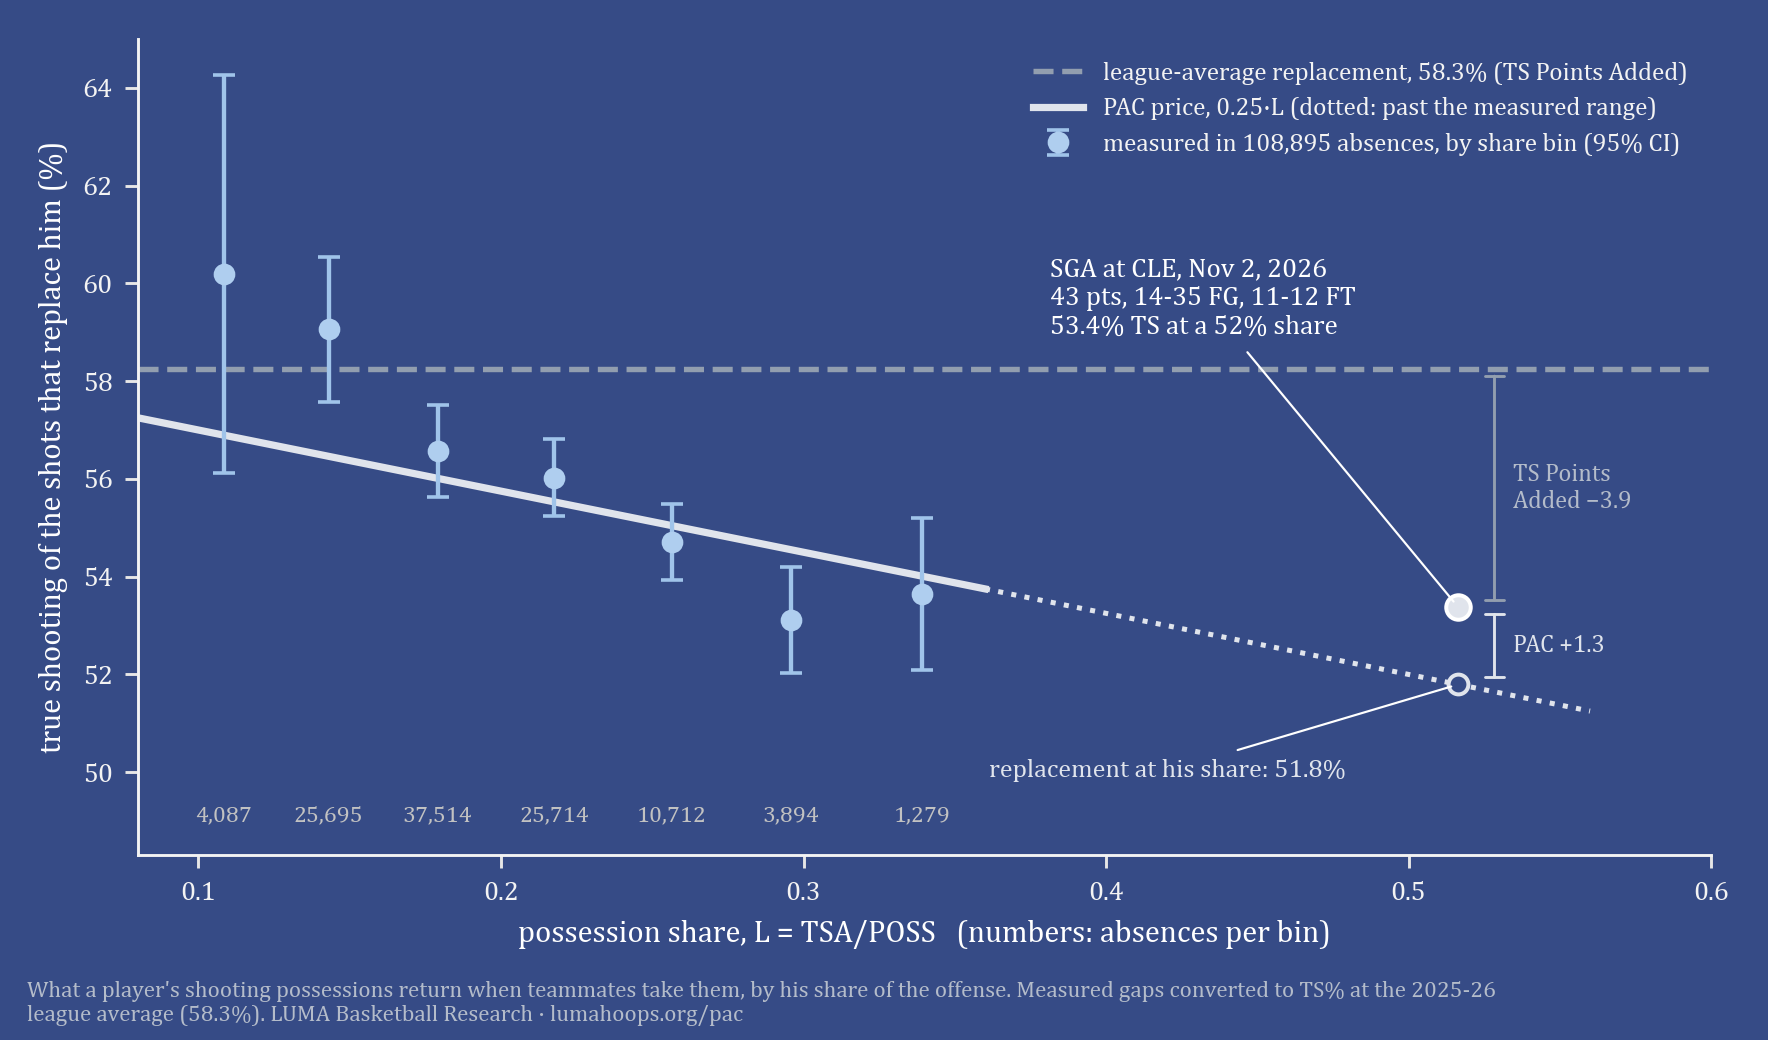
When making PAC I analyzed over 108,000 absences, and the shots that would have replaced SGA's shooting load come back around 52% TS. SGA, despite the kitchen sink being thrown at him, shot 53.4% TS.

True shooting of the shots that replace a player, by his possession share, measured in 108,895 absences, with SGA at Cleveland marked at 53.4% against a 51.8% replacement

If anything this OKC team is uniquely comprised of non-shot creators and the true shooting would have been worse. And those 1.3 points of added efficiency don't account for how their shot diet is easier due to SGA gravity.

Relative true shooting against possession share for qualified player-seasons, with the PAC break-even line and SGA's game at Cleveland marked

Original PAC Post: x.com/Starro____/status/2105998734454632459

League leaders in half-court O-RAPM

  • 2025-27 (to date)
  • 2024-26
  • 2023-25
  • 2022-24
  • 2021-23
#PlayerTeamHC O-RAPM ↓HC poss.O-RAPM, all poss.
1OKC+6.269,216+6.192nd
2GSW+6.246,844+6.053rd
3DEN+6.069,009+6.521st
4DEN+5.759,346+5.315th
5MIL+5.336,224+5.954th
6LAC+4.645,899+5.116th
7CHA+4.516,526+4.567th
8LAL+3.977,559+4.118th
9NYK+3.978,813+4.059th
10CHA+3.544,737+3.4411th
11PHX+3.519,203+3.2314th
12CLE+3.477,232+3.0818th
13LAL+3.428,017+3.0220th
14NYK+3.168,862+2.5235th
15GSW+3.155,488+2.9521st
16BOS+3.126,285+3.1317th
17CLE+3.088,614+3.2813th
18MEM+3.073,226+3.1416th
19WAS+3.066,029+2.8024th
20DET+3.018,416+3.4312th
21DAL+3.003,319+3.0719th
22BKN+2.993,013+2.0553rd
23IND+2.944,515+3.1915th
24IND+2.914,627+2.9322nd
25POR+2.878,129+3.4510th
314 players with 3,000+ half-court possessions. Click a name for his on/off.

On/off impact on half-court scoring

  • Mikal BridgesPHX · BKN · NYK
  • DeMar DeRozanCHI · SAC · DEN
  • Anthony EdwardsMIN
  • Nikola JokićDEN
  • Pascal SiakamTOR · IND
  • Jalen BrunsonDAL · NYK
  • James HardenBKN · PHI · LAC · CLE
  • Shai Gilgeous-AlexanderOKC
  • Derrick WhiteBOS · SAS
  • Tyrese MaxeyPHI
  • Scottie BarnesTOR
  • De'Aaron FoxSAC · SAS
  • Nikola VučevićCHI · BOS · ORL
  • Julius RandleNYK · MIN · BKN
  • Bam AdebayoMIA
  • Harrison BarnesSAC · SAS
  • Kevin DurantBKN · PHX · HOU
  • Rudy GobertUTA · MIN
  • Devin BookerPHX
  • Jaylen BrownBOS · PHI
  • Luka DončićDAL · LAL
  • Josh HartNOP · POR · NYK
  • Jaden McDanielsMIN
  • Donovan MitchellUTA · CLE
  • Jayson TatumBOS
  • CJ McCollumNOP · POR · ATL · WAS
  • Tobias HarrisPHI · DET
  • LeBron JamesLAL · PHI
  • Jalen GreenHOU · PHX
  • Domantas SabonisIND · SAC
  • Evan MobleyCLE
  • Trae YoungATL · WAS
  • Deni AvdijaWAS · POR
  • Royce O'NealeUTA · BKN · PHX · CHA
  • Desmond BaneMEM · ORL
  • Kyle KuzmaWAS · MIL
  • Alperen SengunHOU
  • Franz WagnerORL
  • OG AnunobyTOR · NYK
  • Austin ReavesLAL
  • Darius GarlandCLE · LAC
  • Giannis AntetokounmpoMIL · MIA
  • Stephen CurryGSW
  • Kentavious Caldwell-PopeWAS · DEN · ORL · MEM · PHI
  • Keldon JohnsonSAS
  • Karl-Anthony TownsMIN · NYK
  • Luguentz DortOKC · ATL
  • Jarrett AllenCLE
  • Russell WestbrookLAL · LAC · DEN · SAC
  • Jrue HolidayMIL · BOS · POR
  • RJ BarrettNYK · TOR
  • Dennis SchröderBOS · HOU · LAL · BKN · TOR · GSW · DET · CLE · SAC · CHA
  • Josh GiddeyOKC · CHI
  • Jordan PooleGSW · WAS · NOP
  • P.J. WashingtonCHA · DAL
  • Zach LaVineCHI · SAC
  • Coby WhiteCHI · CHA
  • Miles BridgesCHA · PHX
  • Ayo DosunmuCHI · MIN
  • Buddy HieldIND · SAC · PHI · GSW · CHI
Shai Gilgeous-Alexander
Team pts per 100 half-court poss.Teammates, on / off
SeasonTeamOnOffOff rankOn − offHC O-RAPMUnast. FGTS%Self-created
2026–27*OKC118.394.1small30th+24.2+4.692nd44.9%58.9 / 47.637.9 / 54.5
2025–26OKC119.0106.726th+12.2+6.261st42.6%58.3 / 56.232.8 / 48.4
2024–25OKC119.9105.725th+14.2+5.522nd46.5%58.3 / 55.934.4 / 48.5
2023–24OKC118.4107.523rd+11.0+3.818th43.4%59.7 / 58.835.2 / 47.8
2022–23OKC113.0103.830th+9.2+2.8623rd36.0%55.2 / 54.434.6 / 47.0
2021–22OKC103.094.530th+8.5—31.0%52.0 / 50.930.2 / 40.0
Off: games he played. Off rank: where that figure would rank among the 30 teams. HC O-RAPM: 2-year window ending that season. *2026–27 through November 4.

High-volume games

  • 2026–27 to date5
  • 2025–2623
  • 2024–2533
  • 2023–2429
  • 2022–2326
  • 2021–2222
  • 2021–27, all138
DatePlayerGamePTSFGAFTATSA ↓ShareTS%Break-evenPAC
11/2OKC v CLE43351240.30.5053.452.0+1.1
11/4SAS v DAL52282338.10.5368.251.6+12.6
10/31SAS v MIN4334938.00.5456.651.5+3.9
10/26MIN v CLE4734636.60.4264.153.0+8.2
10/30TOR v ORL4134335.30.4758.052.4+4.0
Games with 35+ true-shooting attempts, the top 0.1% of player-games from 2021–22 to 2025–26. 2026–27 through November 4. TS% in green clears the PAC break-even.

LUMA Basketball Research · Data: public NBA play-by-play · © 2026 Court Share LLC